 squirrelworks
An unmonitored infrastructure node operates as a structural blind spot. Without deterministic runtime intelligence, tracing failure points across container boundaries relies on reactive forensics rather than proactive engineering. This matrix builds out a production-tier observability loop using cloud-native engines to capture, store, and map internal system properties in real time.
Unlike transactional relational models that track state changes as localized records, an infrastructure metric is inherently time-series data. Every variable—whether a CPU consumption spike or an internal database disk flush rate—is captured sequentially over time as a paired coordinates package containing a precise cryptographic millisecond timestamp and a floating-point value string. This persistent stream allows the query execution layer to perform delta transformations, mapping structural historical trends and calculating resource trajectories before failure points cause service degradation.

The object model is strictly hierarchical. The Monitoring Stack serves as the core operational layer. All telemetry data points—including Node CPU usage, Memory limits, Pod states, and Network ingress rates—are stored as time-series metrics. This architecture is essential for tracking cluster health across multiple hardware nodes and containerized application deployments.
Isolating the observability stack within its own logical boundary ensures monitoring workloads do not impact or conflict with active web applications or cluster control-plane processes.
Log onto the control node (rocky-control) via SSH and create a dedicated administrative namespace:
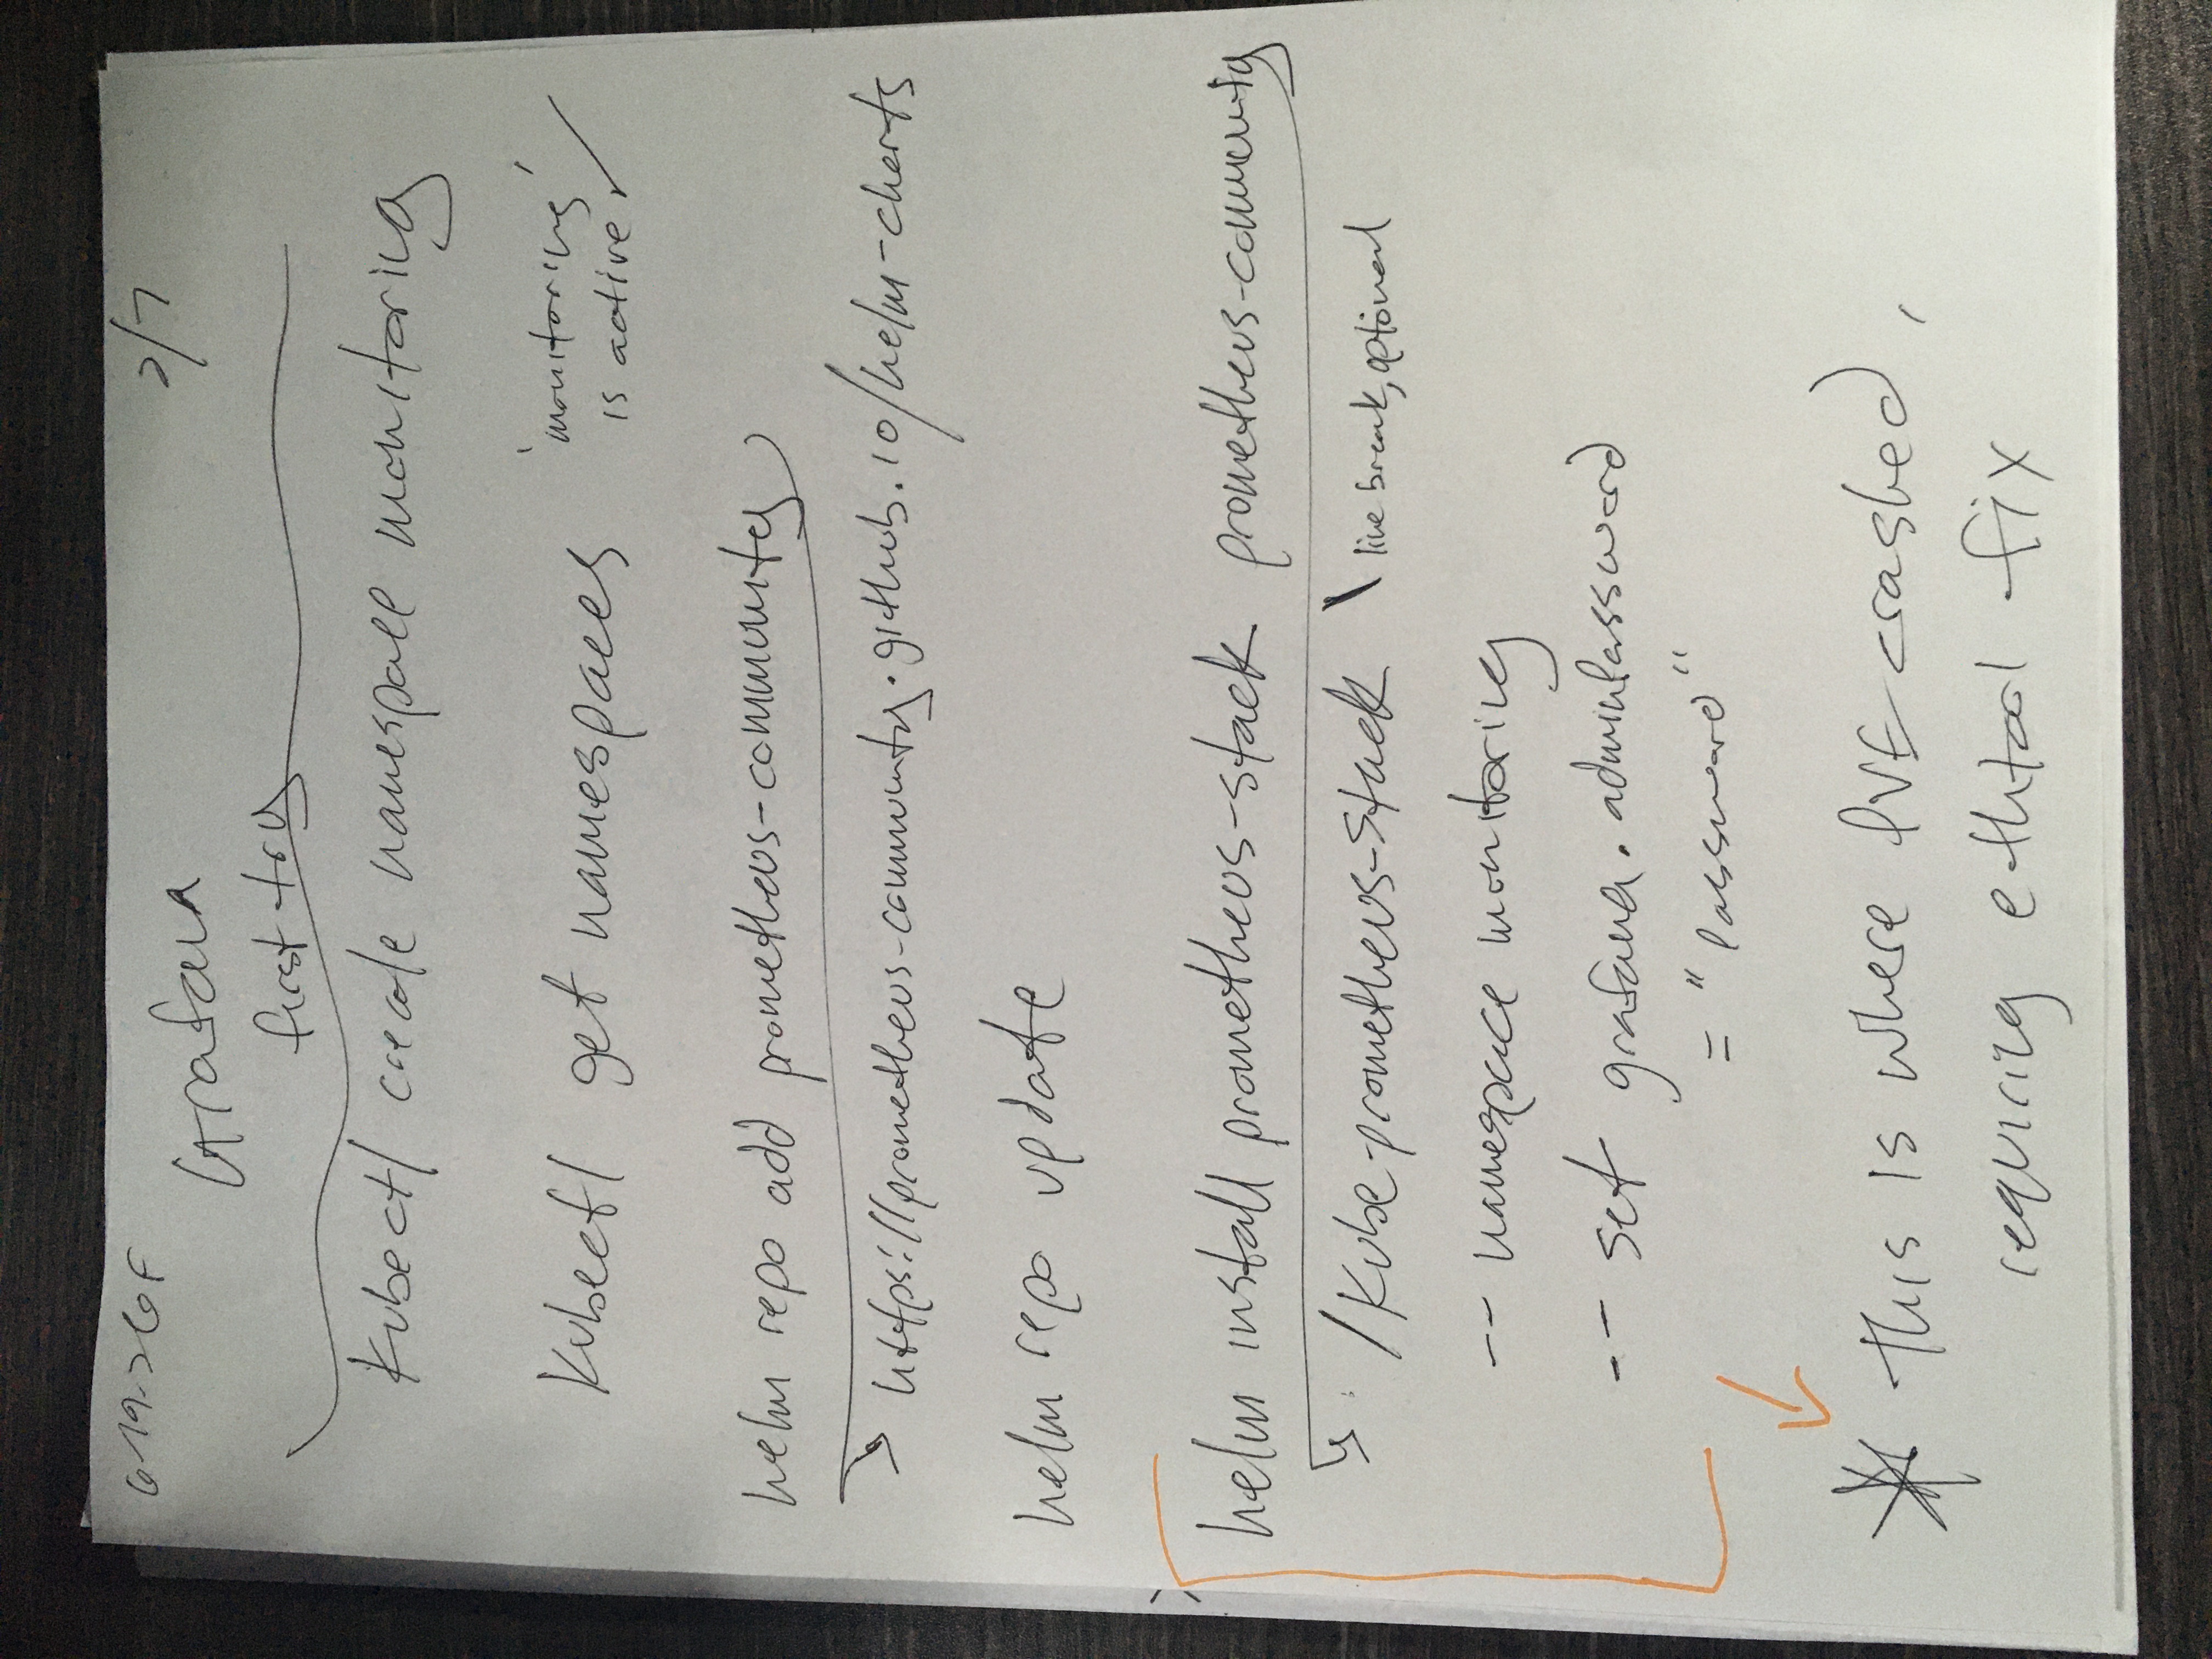
kubectl create namespace monitoringConfirm that the namespace has been successfully initialized into the cluster topology:
kubectl get namespacesThe deployment utilizes the official cloud-native community charts. The packaging tool requires upstream repository registration to pull down the correct component definitions.
Add the remote repository containing the verified manifests to your local Helm configuration:
helm repo add prometheus-community https://prometheus-community.github.io/helm-chartsForce an upstream index update to ensure your control plane is aware of the latest architectural patches and version releases:
helm repo updateThe kube-prometheus-stack chart deploys a complete monitoring suite, including the Prometheus operator, specialized metric collectors, and the frontend web dashboard.
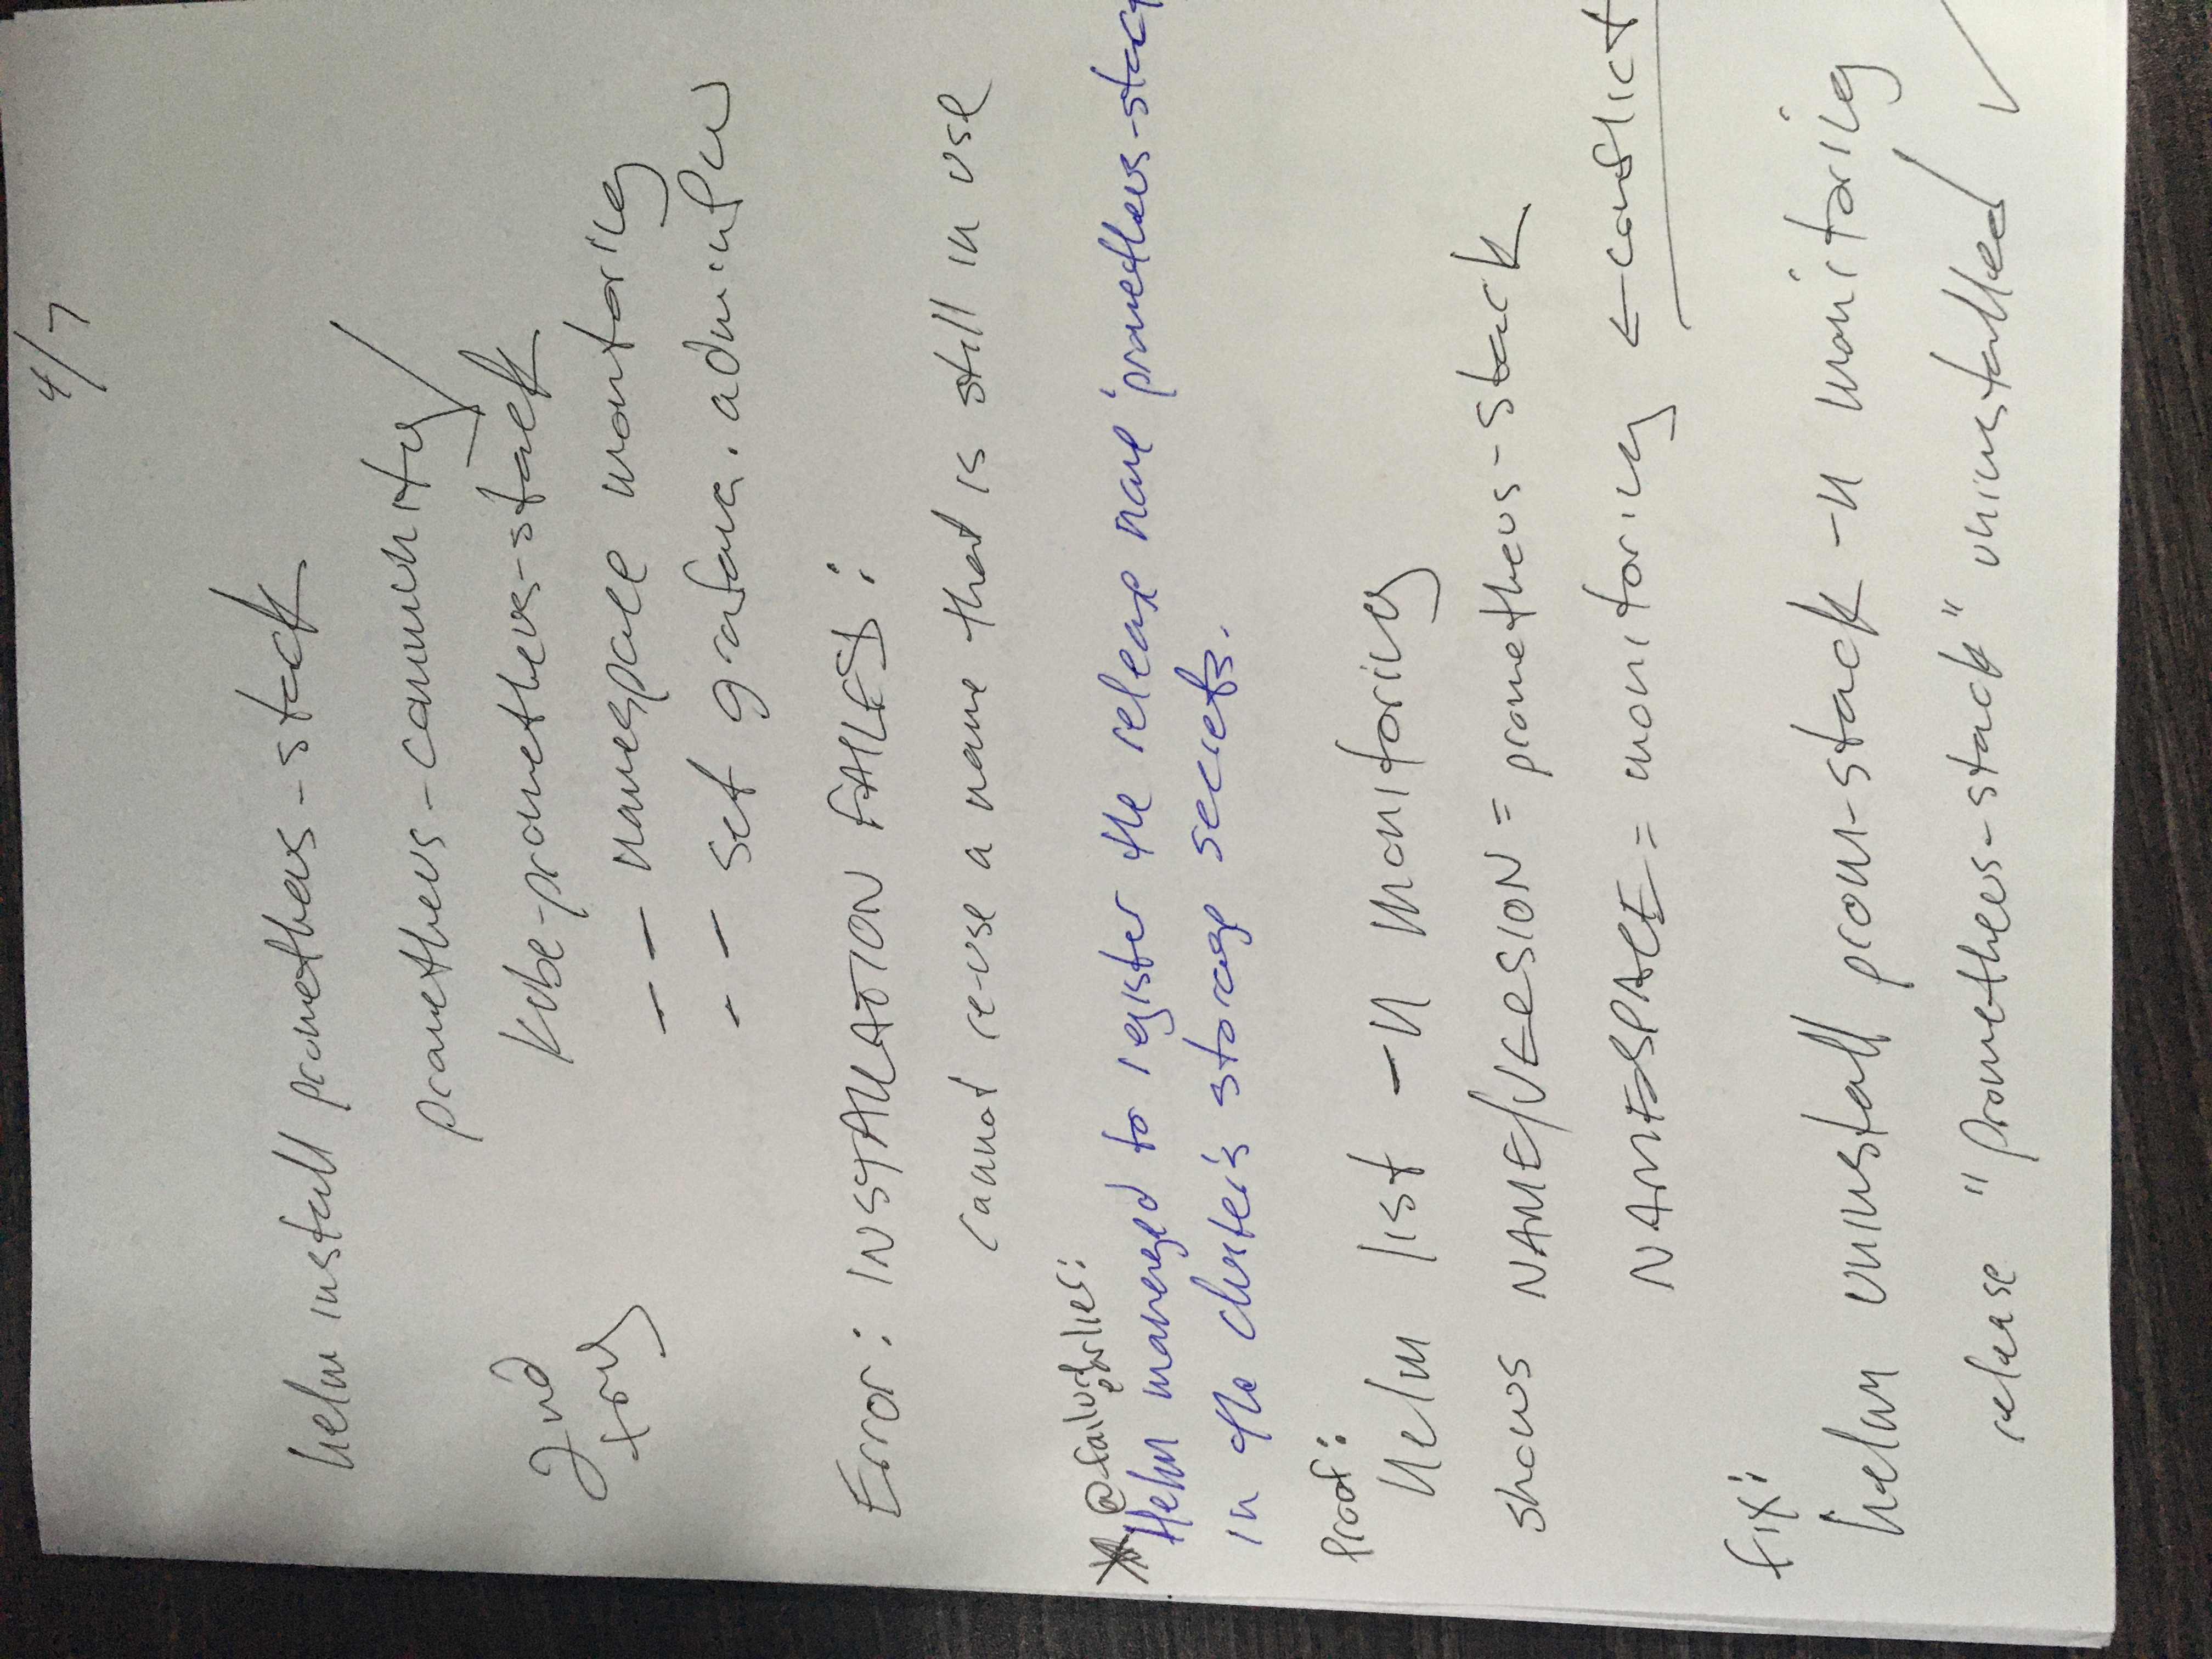
Run the installation command. This payload dynamically handles the deployment of system custom resource definitions (CRDs) and injects a custom administrative password into the frontend web configuration:
helm install prometheus-stack prometheus-community/kube-prometheus-stack \
  --namespace monitoring \
--set grafana.adminPassword='YourSecurePasswordHere'Distributed system images take time to download and mount storage. This step functions as the active validation phase to catch initialization faults.
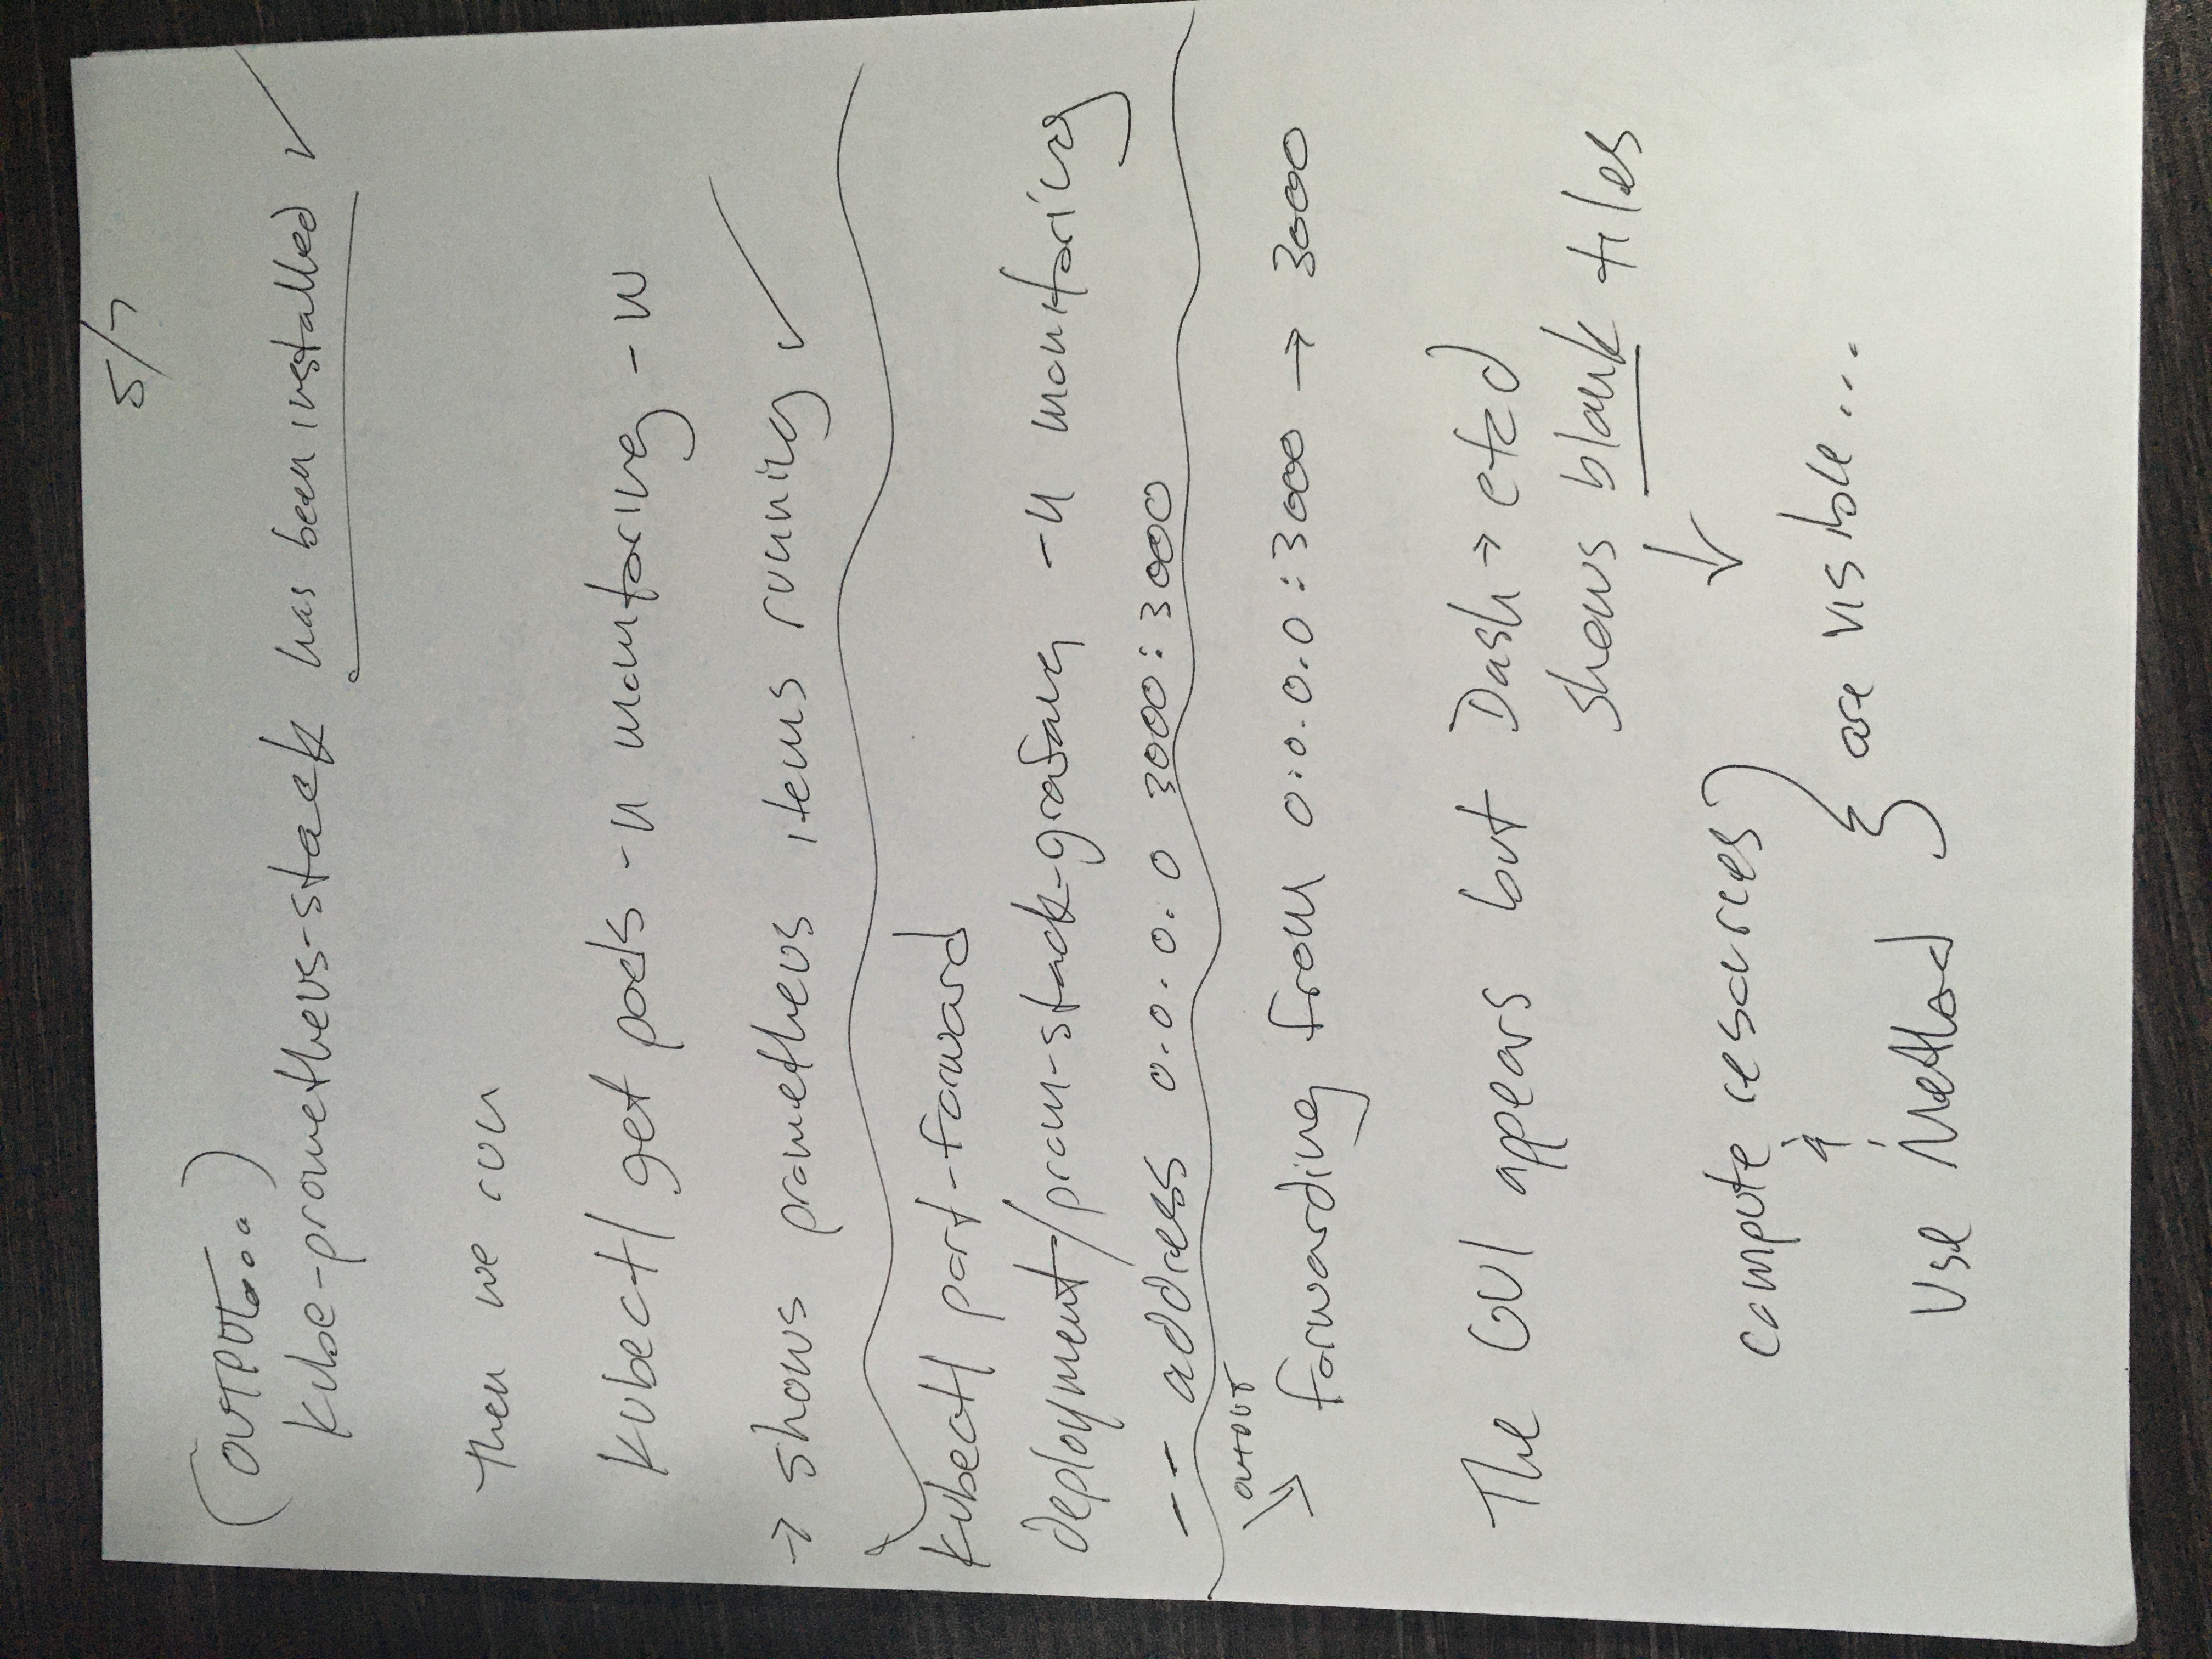
kubectl get pods -n monitoring -w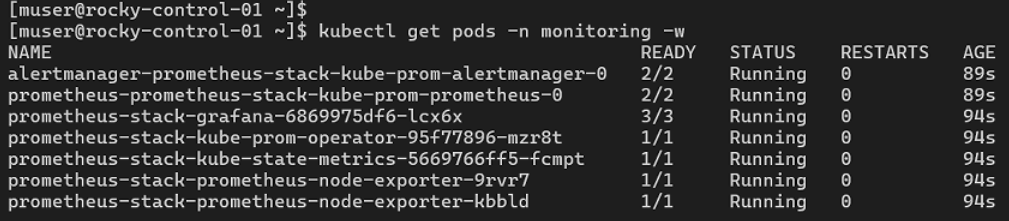
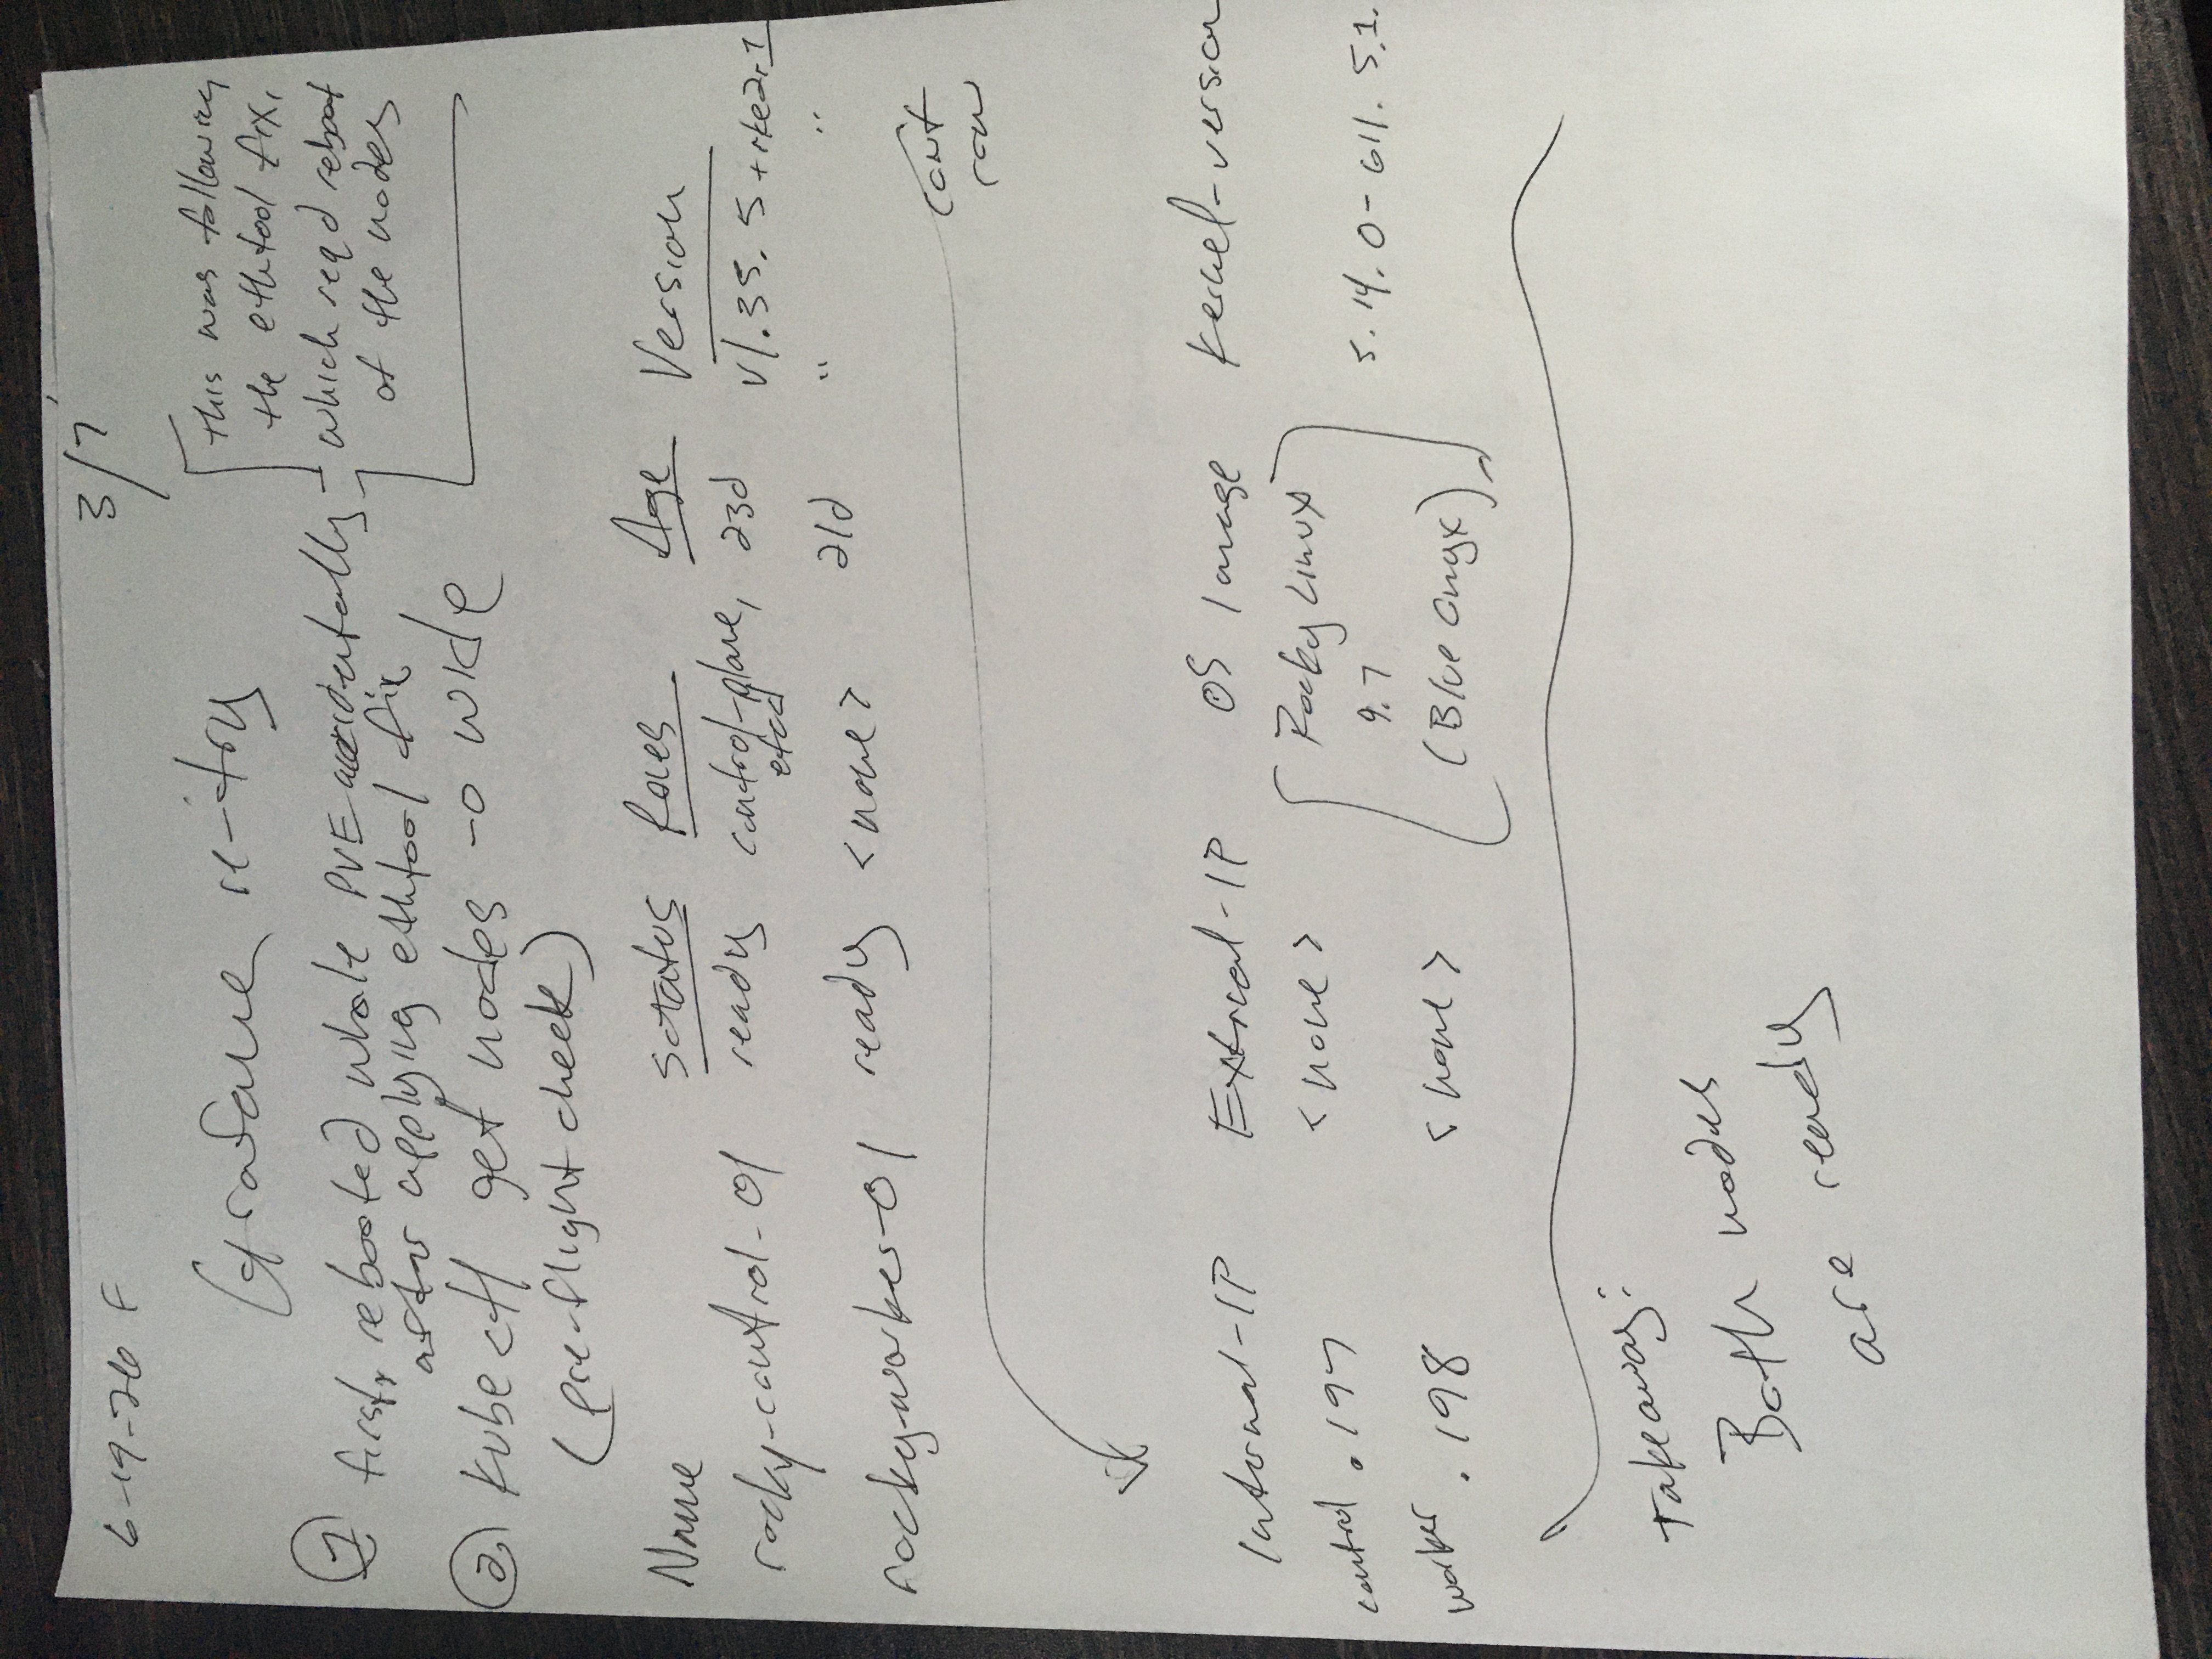
Core internal components (such as prometheus-stack-operator and kube-state-metrics) must transition to a clean 1/1 status under the READY column before proceeding.
The prometheus-node-exporter pods must spin up as a duplicate pair, proving that one daemon agent is attached to your server hardware and the second is managing your worker hardware.
Once the containers settle, the web dashboard remains trapped within the cluster’s internal overlay network. To access the interactive dashboards, pick one of the following integration paths.
To audit the environment securely without altering public domain records, proxy the dashboard traffic directly to your desktop over SSH:
kubectl port-forward deployment/prometheus-stack-grafana 3000:3000 -n monitoringAccess via browser at http://localhost:3000 using the admin user parameters.
To route public traffic to your metrics engine via RKE2's reverse-proxy, create an Ingress manifest file named grafana-ingress.yaml:
spec:
  rules:
  - host: monitor.squirrelworks.dev
    http:
      paths:
      - path: /
        pathType: Prefix
        backend:
          service:
            name: prometheus-stack-grafana
            port:
              number: 80
kubectl apply -f grafana-ingress.yaml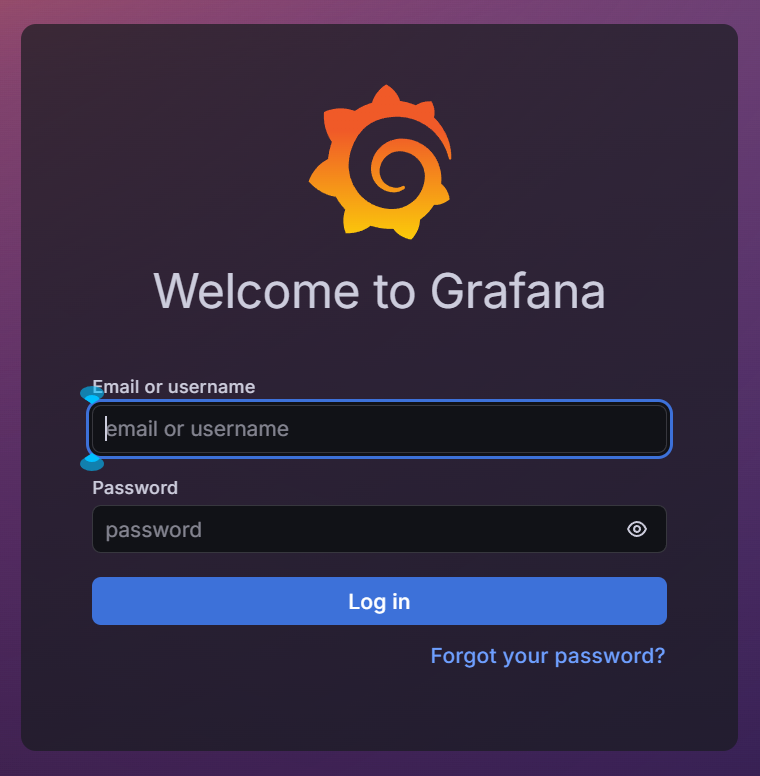
Unlike declarative deployments or services, a kubectl port-forward execution is an active runtime process rather than a static configuration modification. To maintain structural external browser access across local local area network (LAN) workstations, the binding address space must be broadened and explicitly left operational inside the terminal environment.
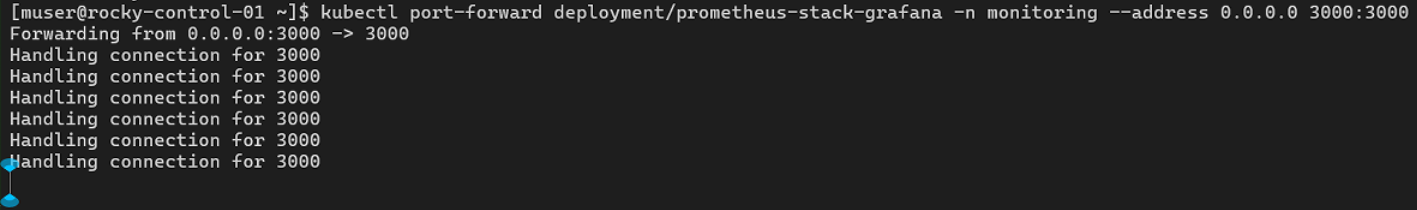
By default, a port-forward ties exclusively to loopback addresses. Appending the --address 0.0.0.0 flag instructs the Kubernetes API server to bind to all physical network adapters on your control plane node:
kubectl port-forward deployment/prometheus-stack-grafana -n monitoring --address 0.0.0.0 3000:3000
⚠️ Core Architectural Operational Rule: This script execution will intentionally hang and lock the prompt—this state is required to keep the raw TCP socket translation bridge active. Issuing a keyboard interrupt command (Ctrl + C) or killing the host terminal shell immediately drops the network sockets, resulting in an immediate ERR_CONNECTION_REFUSED state inside your browser window.
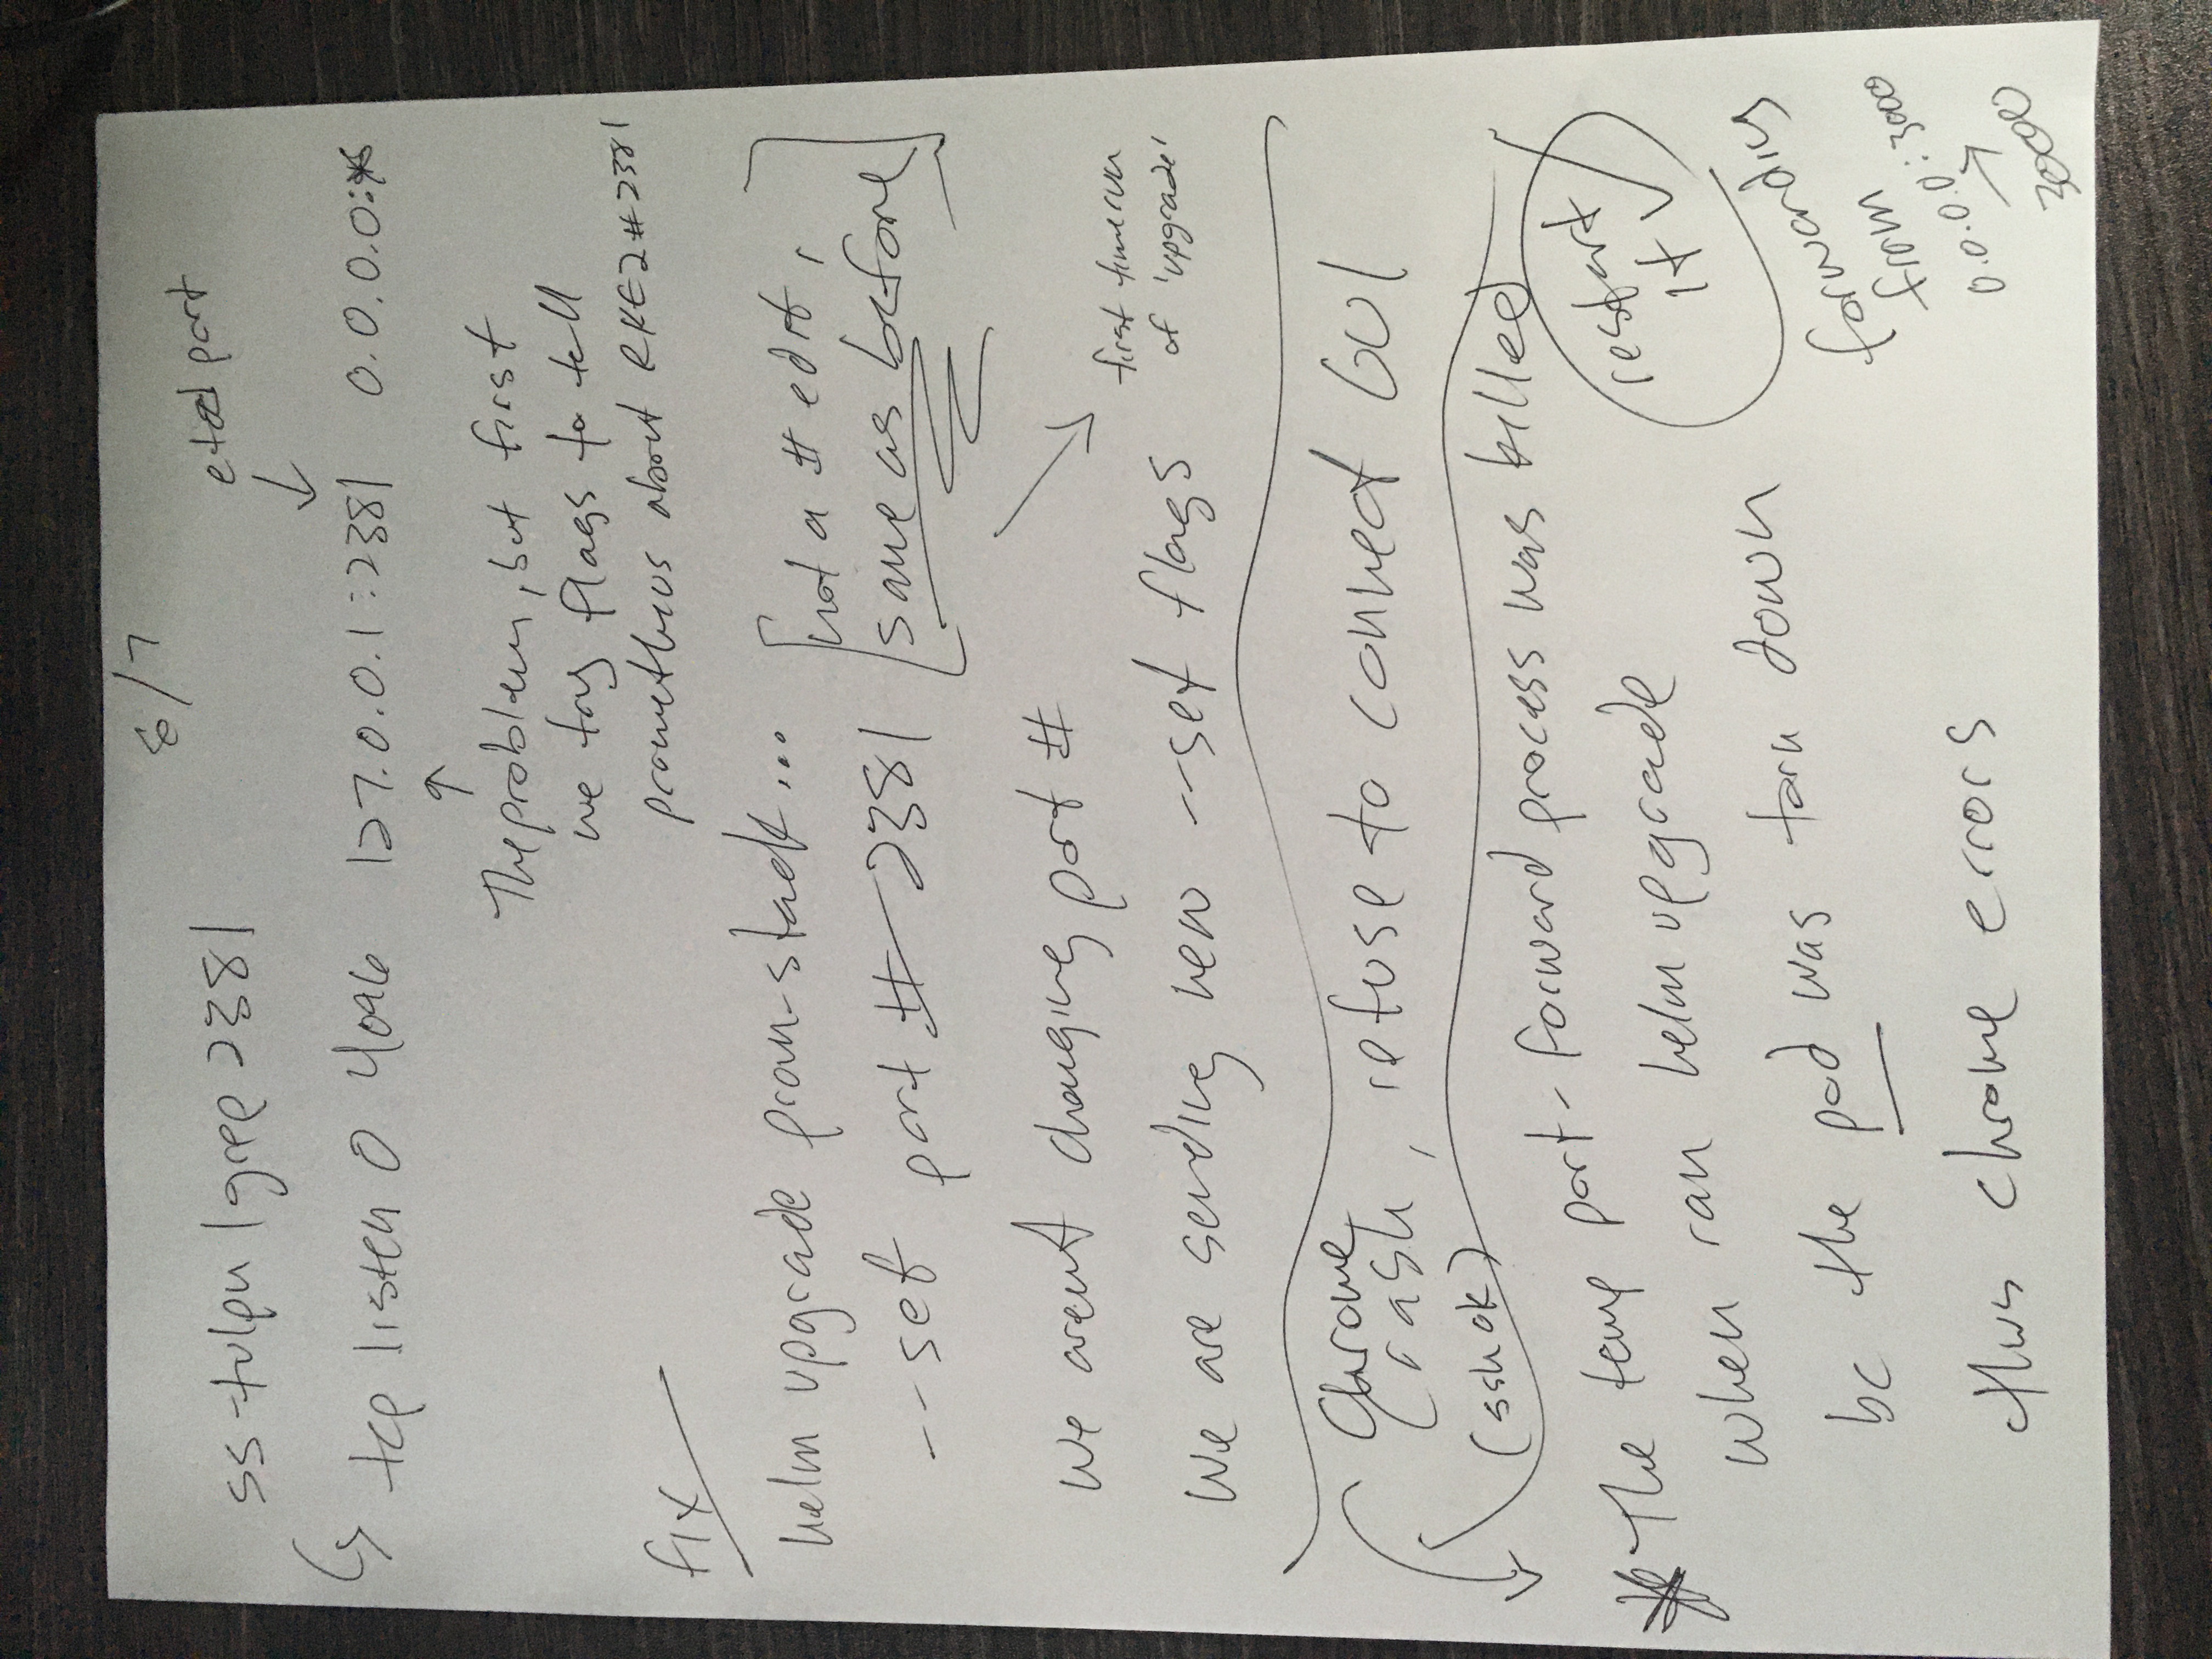
A default kube-prometheus-stack installation expects a vanilla Kubernetes infrastructure map where metrics are exposed openly across the cluster network. Because RKE2 prioritizes an enterprise security baseline, it wraps the internal etcd state database inside an isolated jail that explicitly rejects metric scrapes originating from external pod subnets.
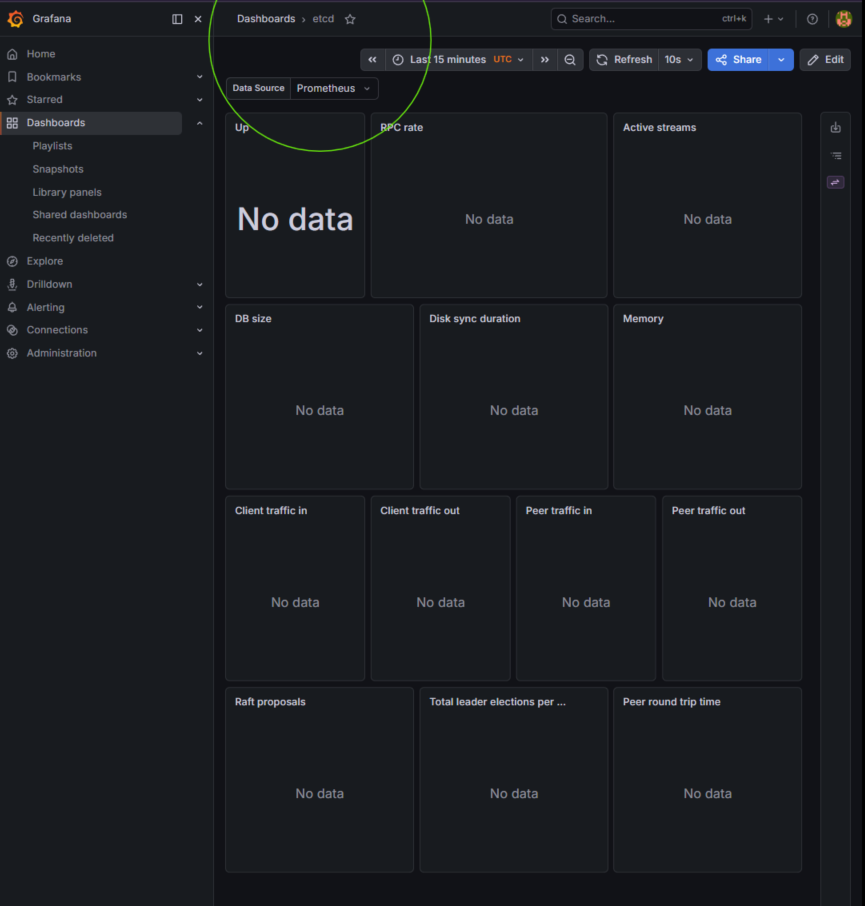
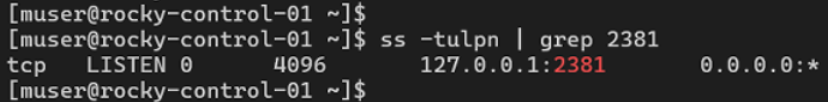
Auditing host network sockets using ss -tulpn | grep 2381 confirms the telemetry listener is bound explicitly to 127.0.0.1:2381. The Prometheus scraper engines attempting to pool data on the node's LAN IP address are instantly dropped, rendering empty dashboards.
By updating the core RKE2 service configuration parameters, the etcd-arg layer is instructed to bind its metric matrix to 0.0.0.0:2381, safely exposing database telemetry variables to the internal cluster scraper engines.
Fire a Helm upgrade release to re-align your monitoring target endpoints to port 2381:
helm upgrade prometheus-stack prometheus-community/kube-prometheus-stack \
  --namespace monitoring \
  --reuse-values \
  --set kubeEtcd.enabled=true \
  --set kubeEtcd.service.port=2381 \
  --set kubeEtcd.service.targetPort=2381 \
  --set kubeScheduler.enabled=false \
  --set kubeControllerManager.enabled=false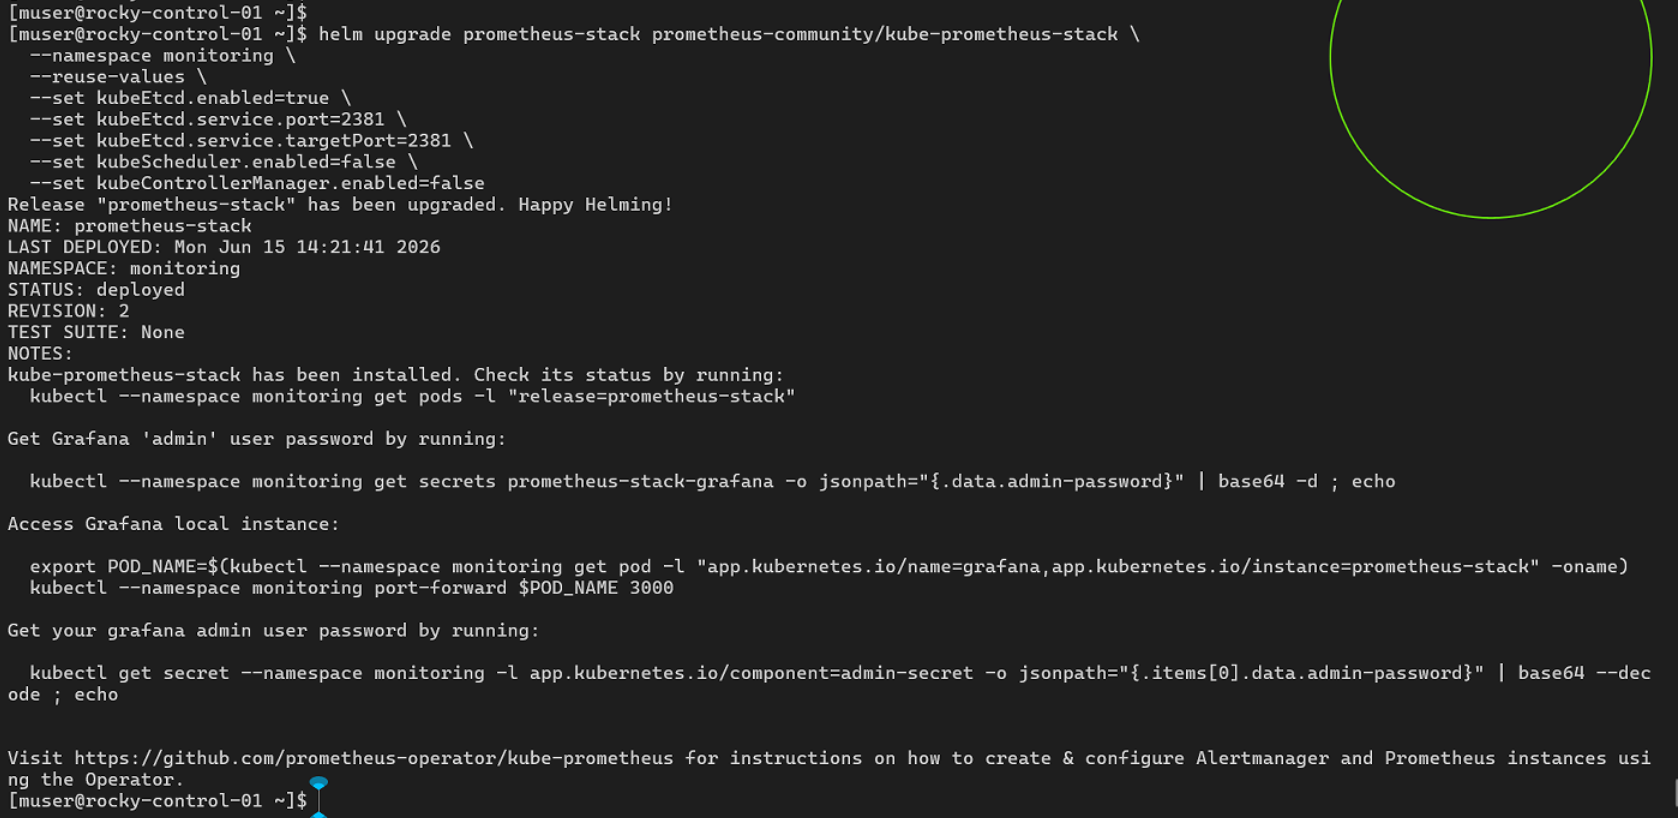
Open a secondary terminal session, maintain root privileges, and drop into the system configuration file:
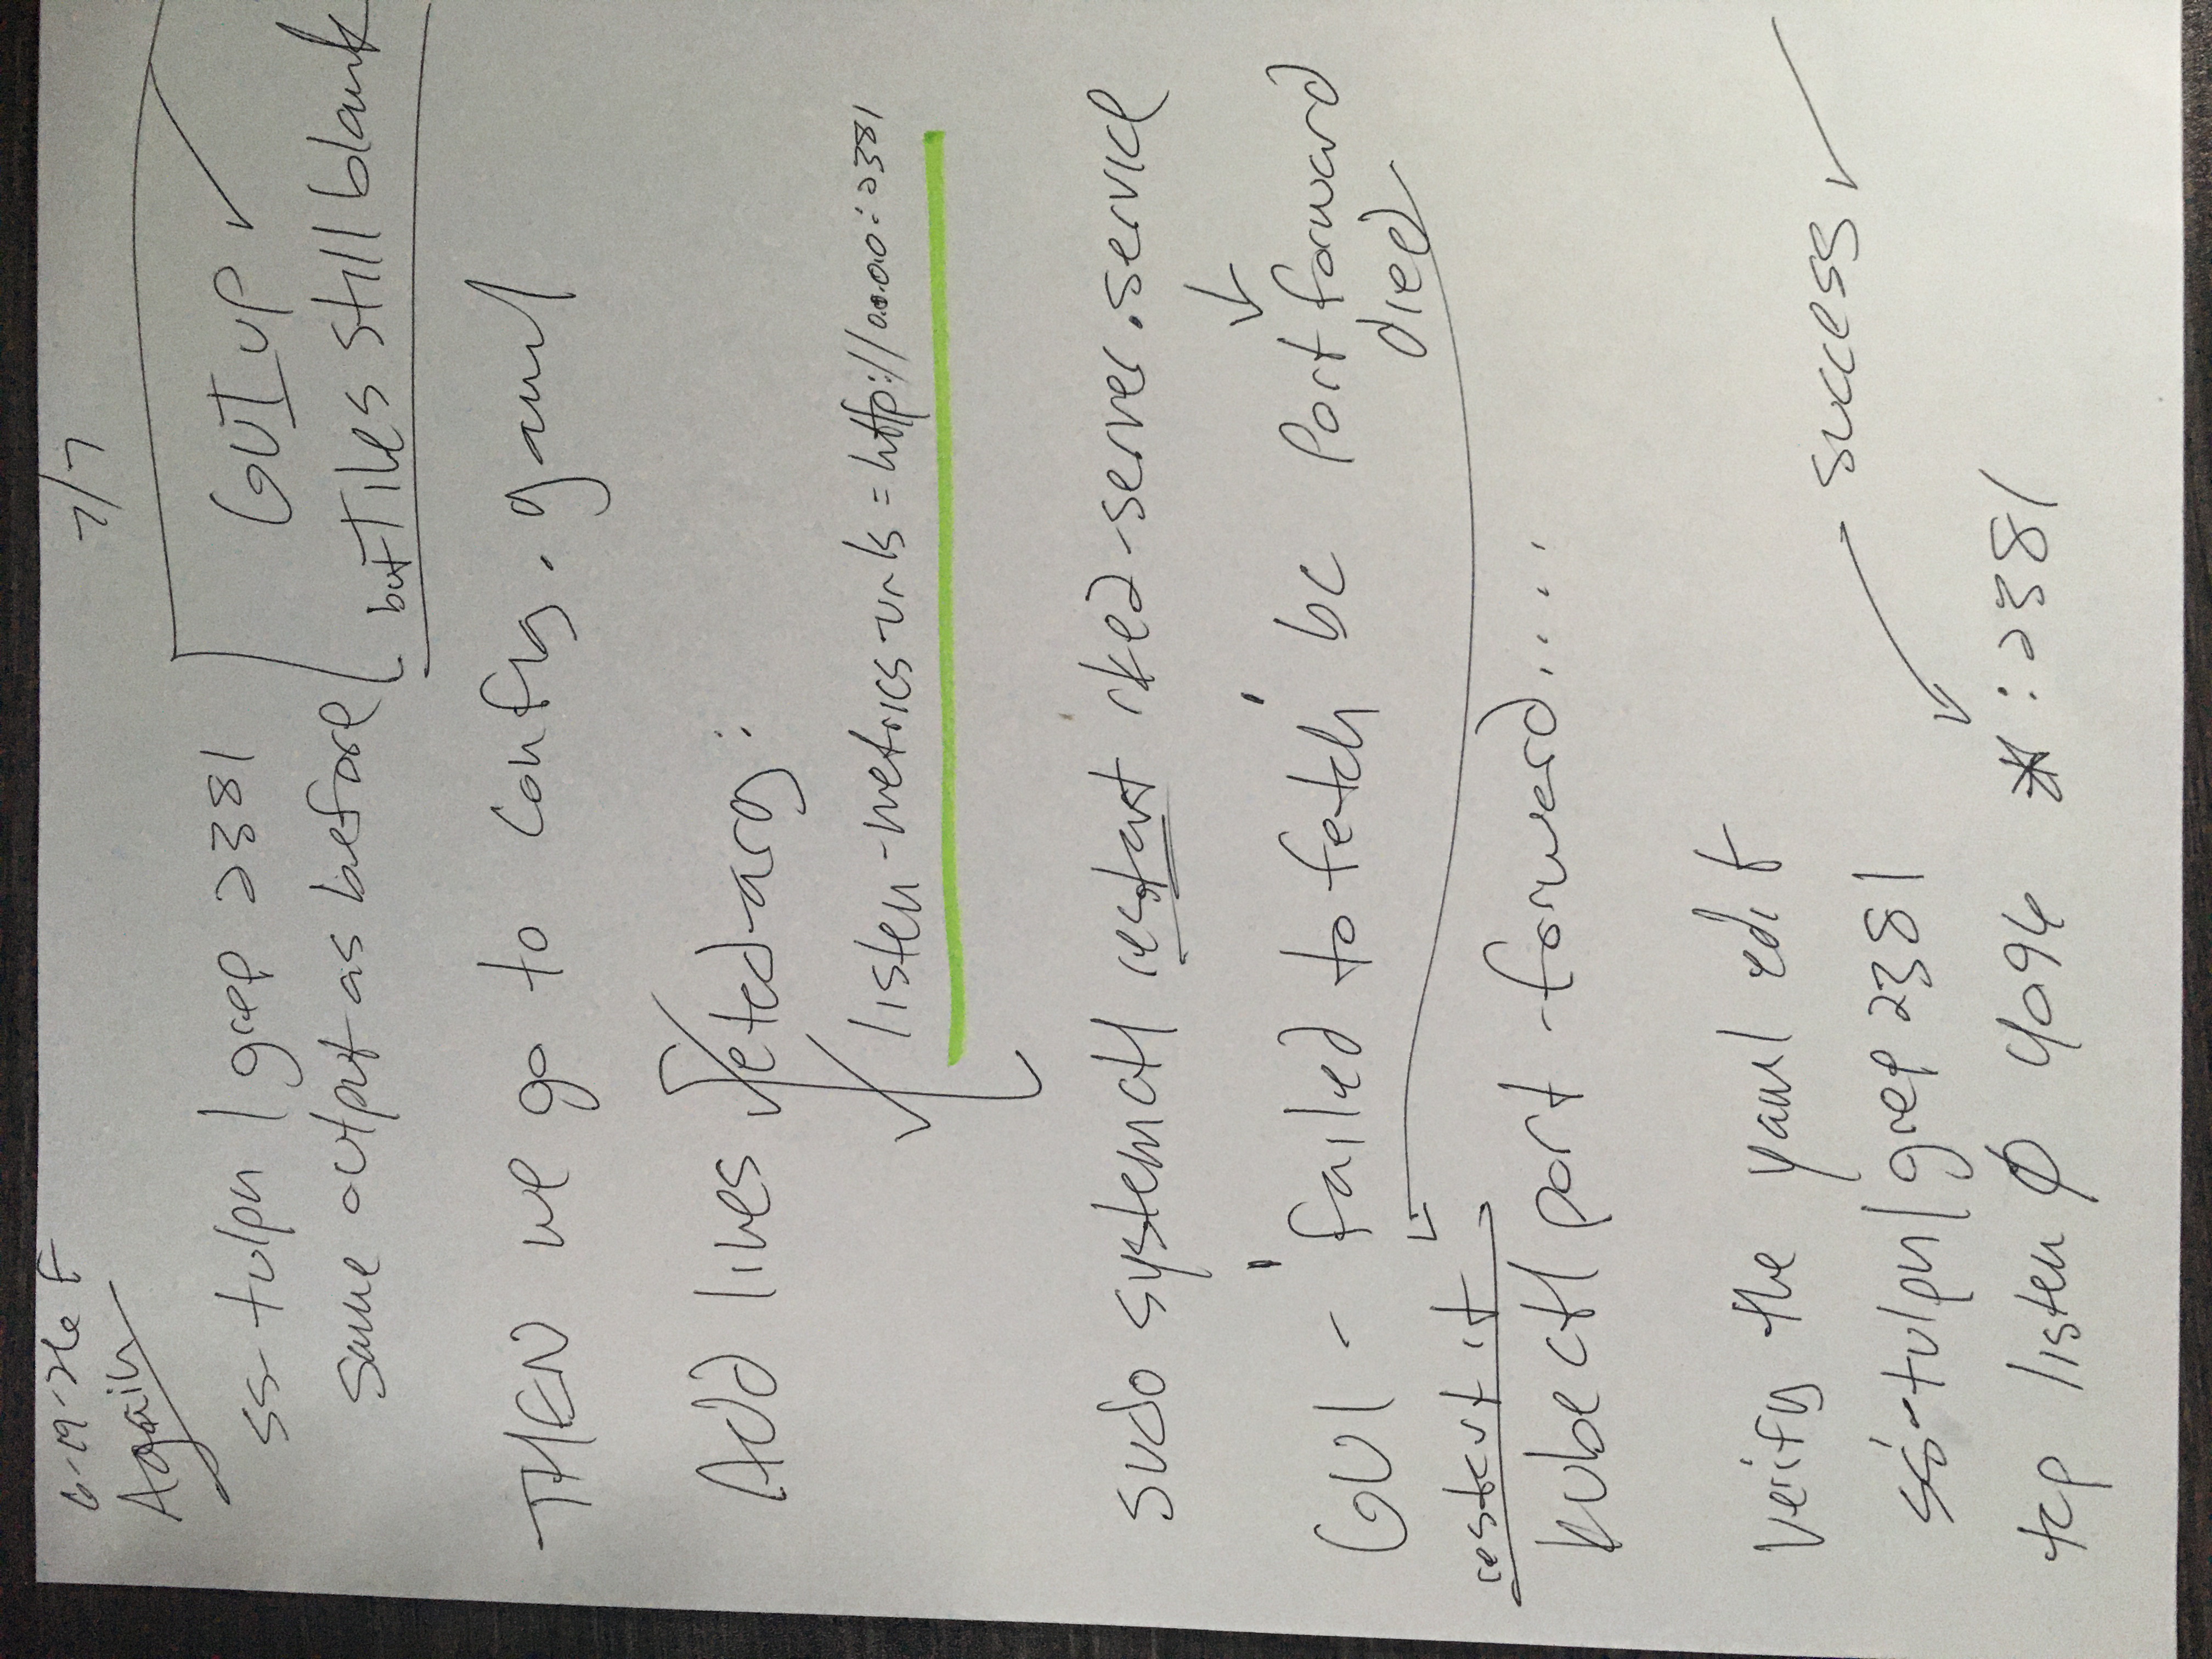
sudo nano /etc/rancher/rke2/config.yamlAppend the explicit etcd listening configuration argument tree down at the bottom of the manifest:
etcd-arg:
  - "listen-metrics-urls=http://0.0.0.0:2381"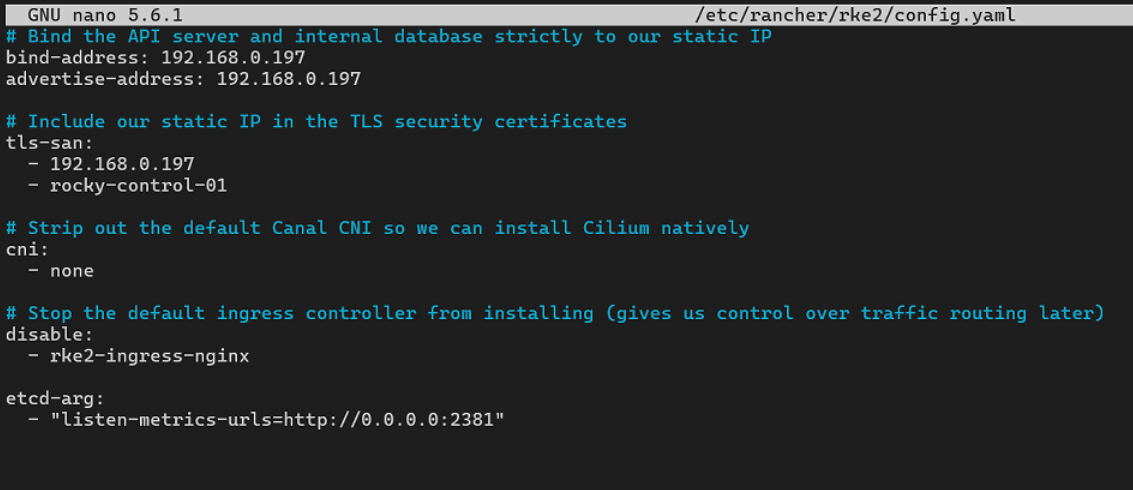
Force the host system engine to cycle its processes and ingest the new variables with a restart. This will kill the port-forward state, requiring it's restart!
sudo systemctl restart rke2-server.serviceVerify the new port binding:
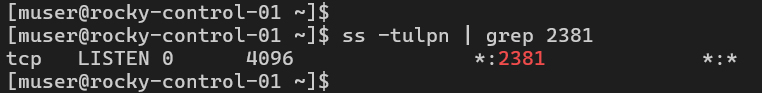
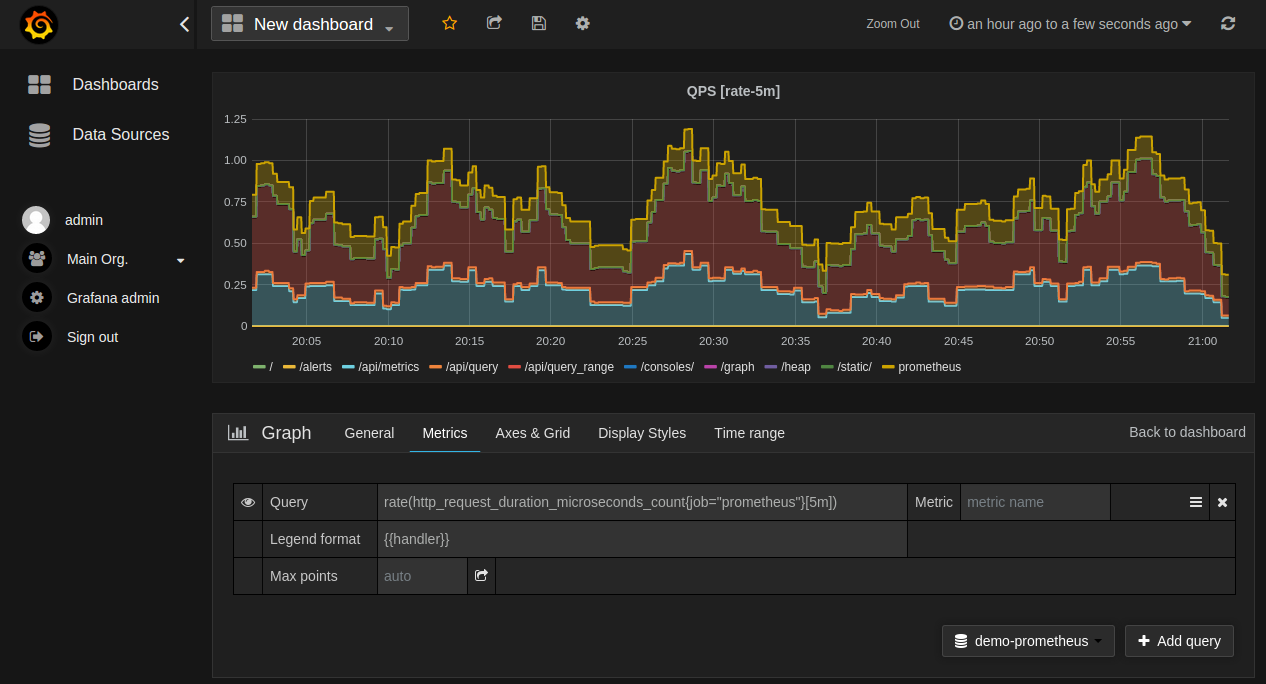
The GUI dashboard is now ready:
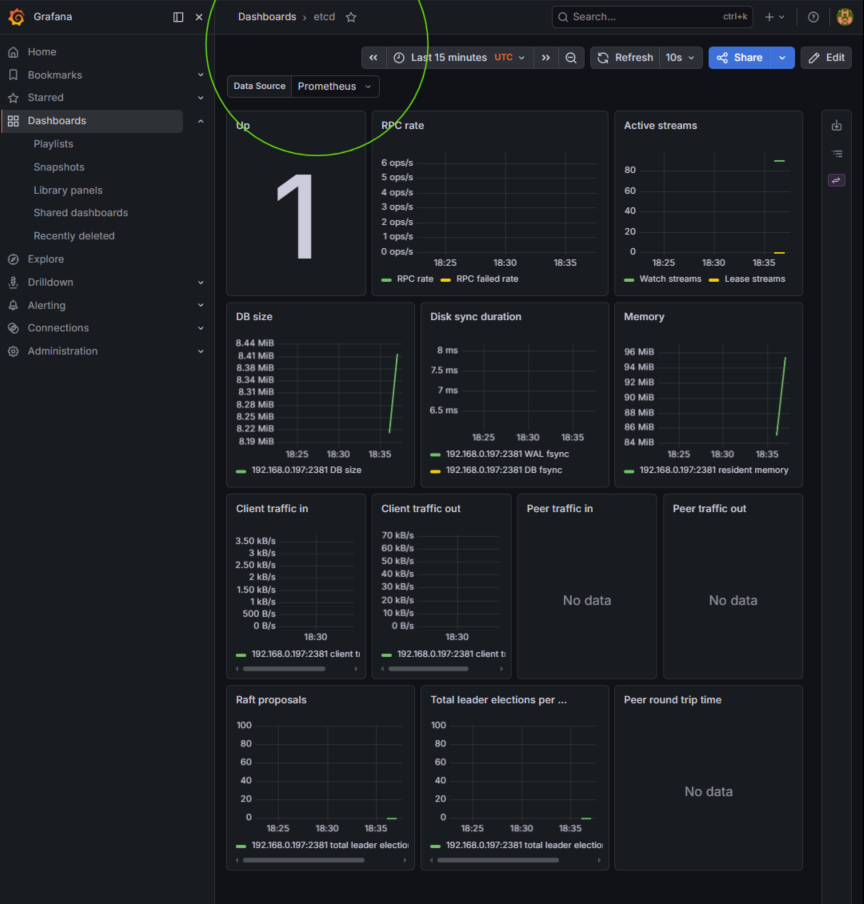
By decoupling the etcd metrics listener from local loopback restrictions while maintaining strict internal namespace routing, the cluster achieves a verified zero-trust observability posture. Prometheus now securely ingests core engine state variables without exposing the underlying database control plane to external network subnets—ensuring the structural integrity of both data collection and infrastructure defenses.
Recap: