 squirrelworks
When managing production-grade infrastructure via SSH, you quickly run into a classic operational limitation: the moment your local terminal window closes, your wireless connection drops, or your laptop sleeps, the remote SSH process dies instantly. For long-running administrative tasks or continuous platform monitoring, this is a glaring vulnerability.
TMUX (Terminal Multiplexer) decouples your terminal session from your network connection. It runs a lightweight server daemon directly on the host instance. Inside a single network window, TMUX allows you to split your viewport into an organized grid of multiple responsive panes, each processing active server workloads concurrently.

If a network drop occurs, your code scripts and telemetry engines don't care. They continue executing securely on the server backplane, completely isolated from client-side instability. You simply log back in, attach to the running session, and find your environment exactly as you left it.
First, ensure the utility package is present on the Enterprise Linux baseline and initialize a dedicated, background-persistent execution session named cluster-monitor.
# Deploy utility onto the control host
sudo dnf install -y tmux

# Spin up a dedicated persistent session
tmux new -s cluster-monitorTMUX processes interactive layout manipulations using a dynamic command prefix: Ctrl + b. To segment our view into a high-visibility, three-pane Network Operations Center (NOC) dashboard layout, we map horizontal and vertical splits across the active viewport.
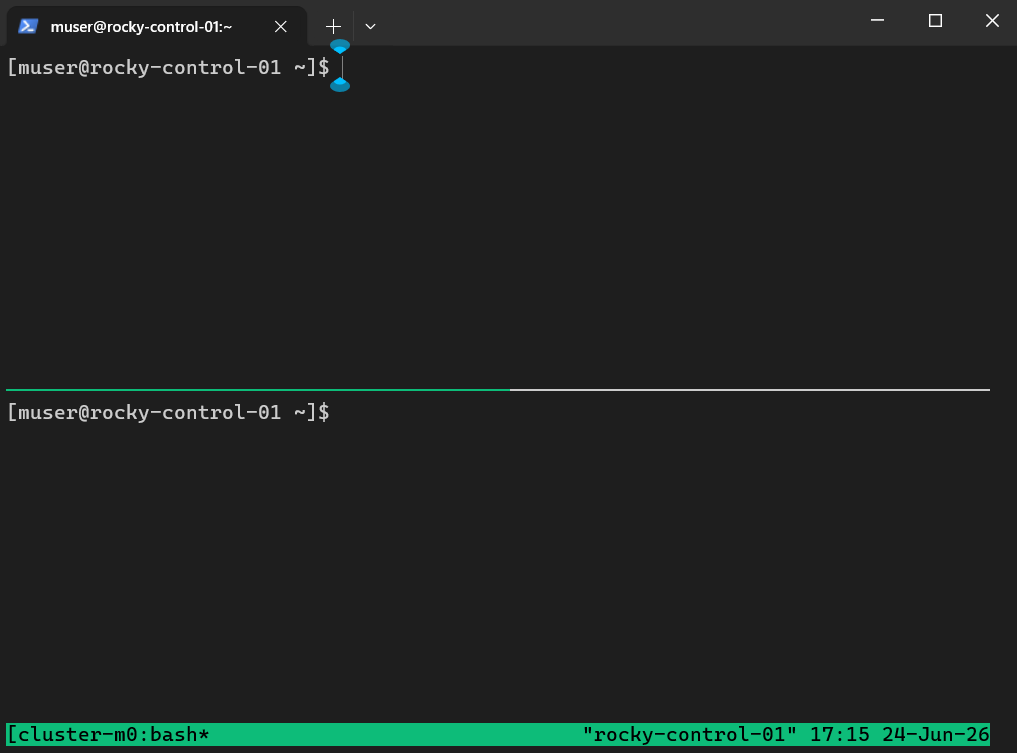
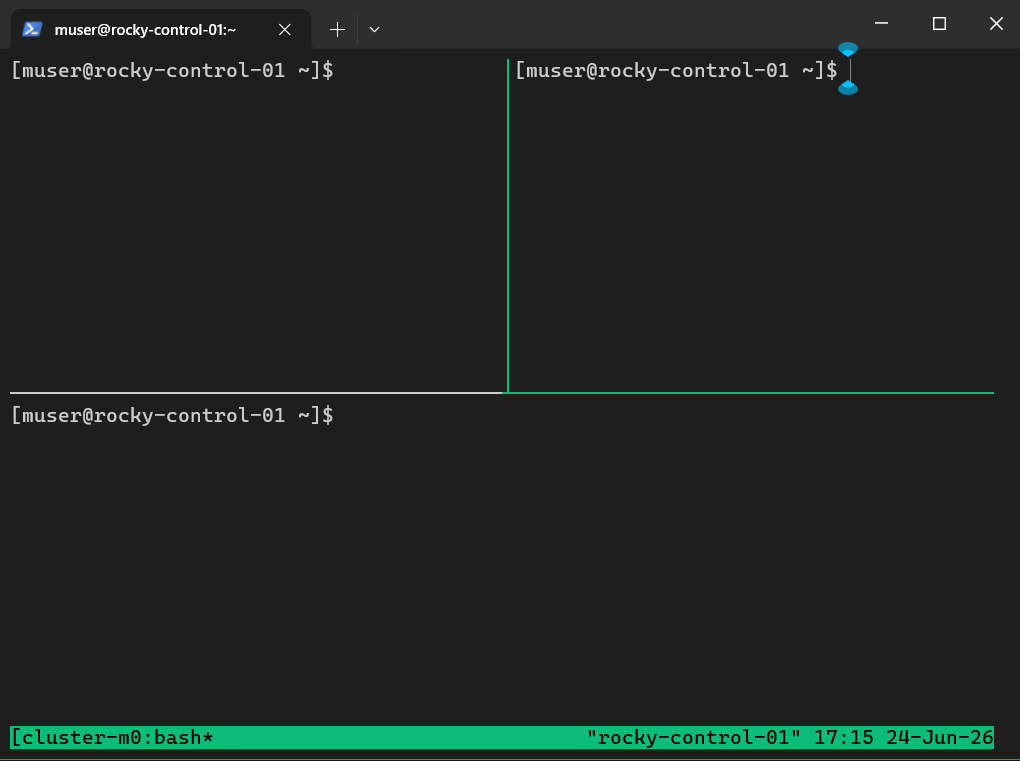
" — Splits the terminal view horizontally into upper and lower halves.Up Arrow — Shifts your prompt focus back to the top section.% — Splits that top half vertically into symmetrical left and right monitoring columns.
With our grid partitions configured, we switch focus into each independent frame and spin up perpetual Bash execution loops. These loops interact directly with the underlying RKE2 components, refreshing automated state outputs every few seconds.
while true; do
  clear;
  echo "=== SQUIRRELWORKS CLUSTER NODE HEALTH SUMMARY ===";
  date;
  echo "------------------------------------------------";
  sudo /var/lib/rancher/rke2/bin/kubectl --kubeconfig /etc/rancher/rke2/rke2.yaml get nodes;
  sleep 5;
done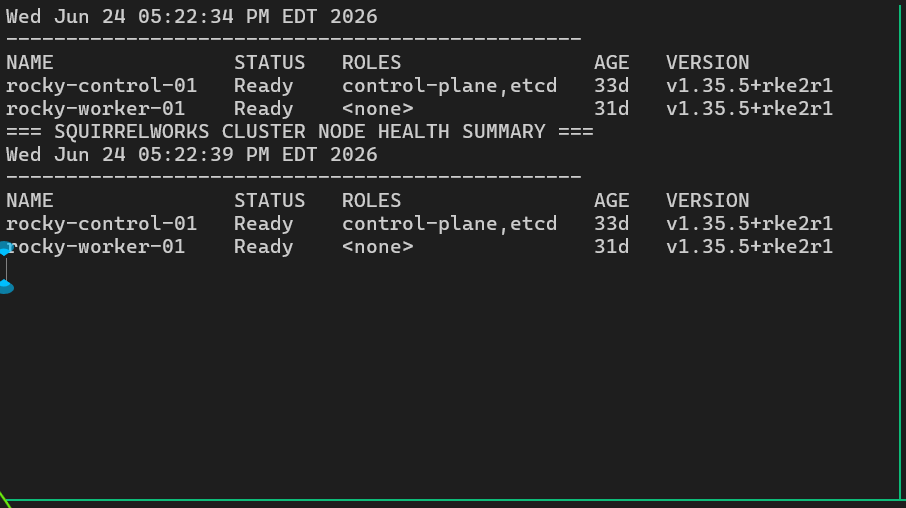
while true; do
  clear;
  echo "=== ACTIVE WORKLOAD RUNTIME STATUS ===";
  date;
  echo "-------------------------------------";
  sudo /var/lib/rancher/rke2/bin/kubectl --kubeconfig /etc/rancher/rke2/rke2.yaml get pods -A | grep -E "grafana|drupal|coredns";
  sleep 5;
done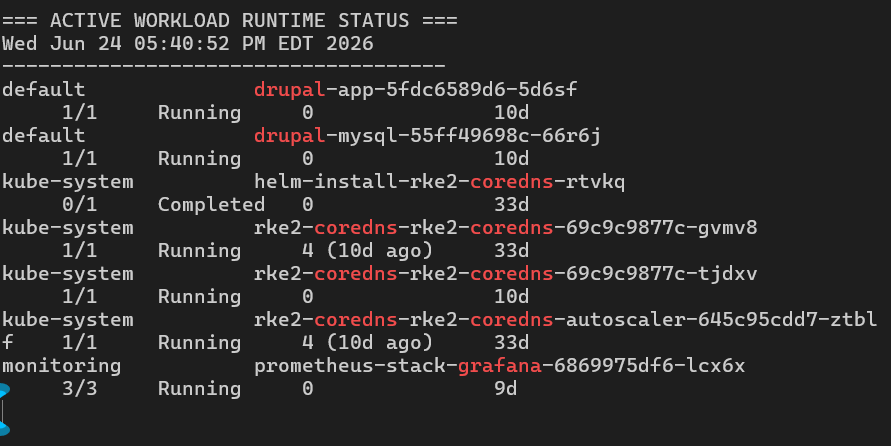
while true; do
  clear;
  echo "=== eBPF CNI FABRIC METRICS ===";
  date;
  echo "-------------------------------";
  sudo /var/lib/rancher/rke2/bin/helm upgrade cilium cilium/cilium --version 1.15.4 --namespace kube-system --kubeconfig /etc/rancher/rke2/rke2.yaml status 2>/dev/null | grep -A 5 "STATUS:";
  echo "";
  sudo /var/lib/rancher/rke2/bin/kubectl --kubeconfig /etc/rancher/rke2/rke2.yaml get pods -n kube-system | grep cilium;
  sleep 10;
done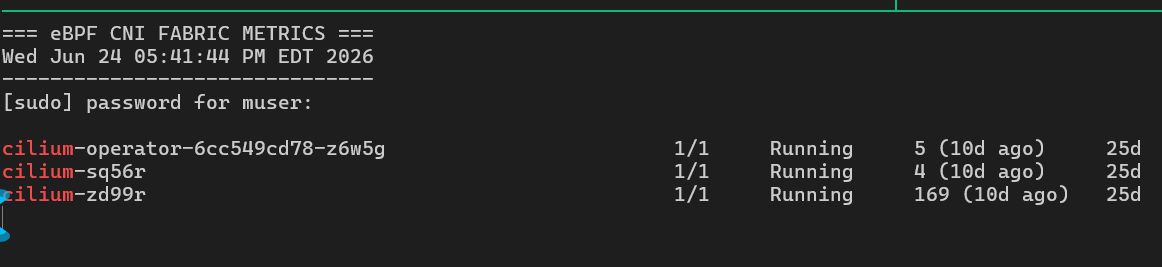
Once all monitoring loops are active, you can safely disconnect your local workstation shell from the control node without altering system states.
Execute the detachment sequence: Press Ctrl + b, then release and type d.
Your local terminal prompt will immediately exit back to standard shell configurations with a verification message outputting: [detached (from session cluster-monitor)].

To call the operational grid back onto any active terminal connection at a later date, issue the native recovery command:
tmux attach -t cluster-monitor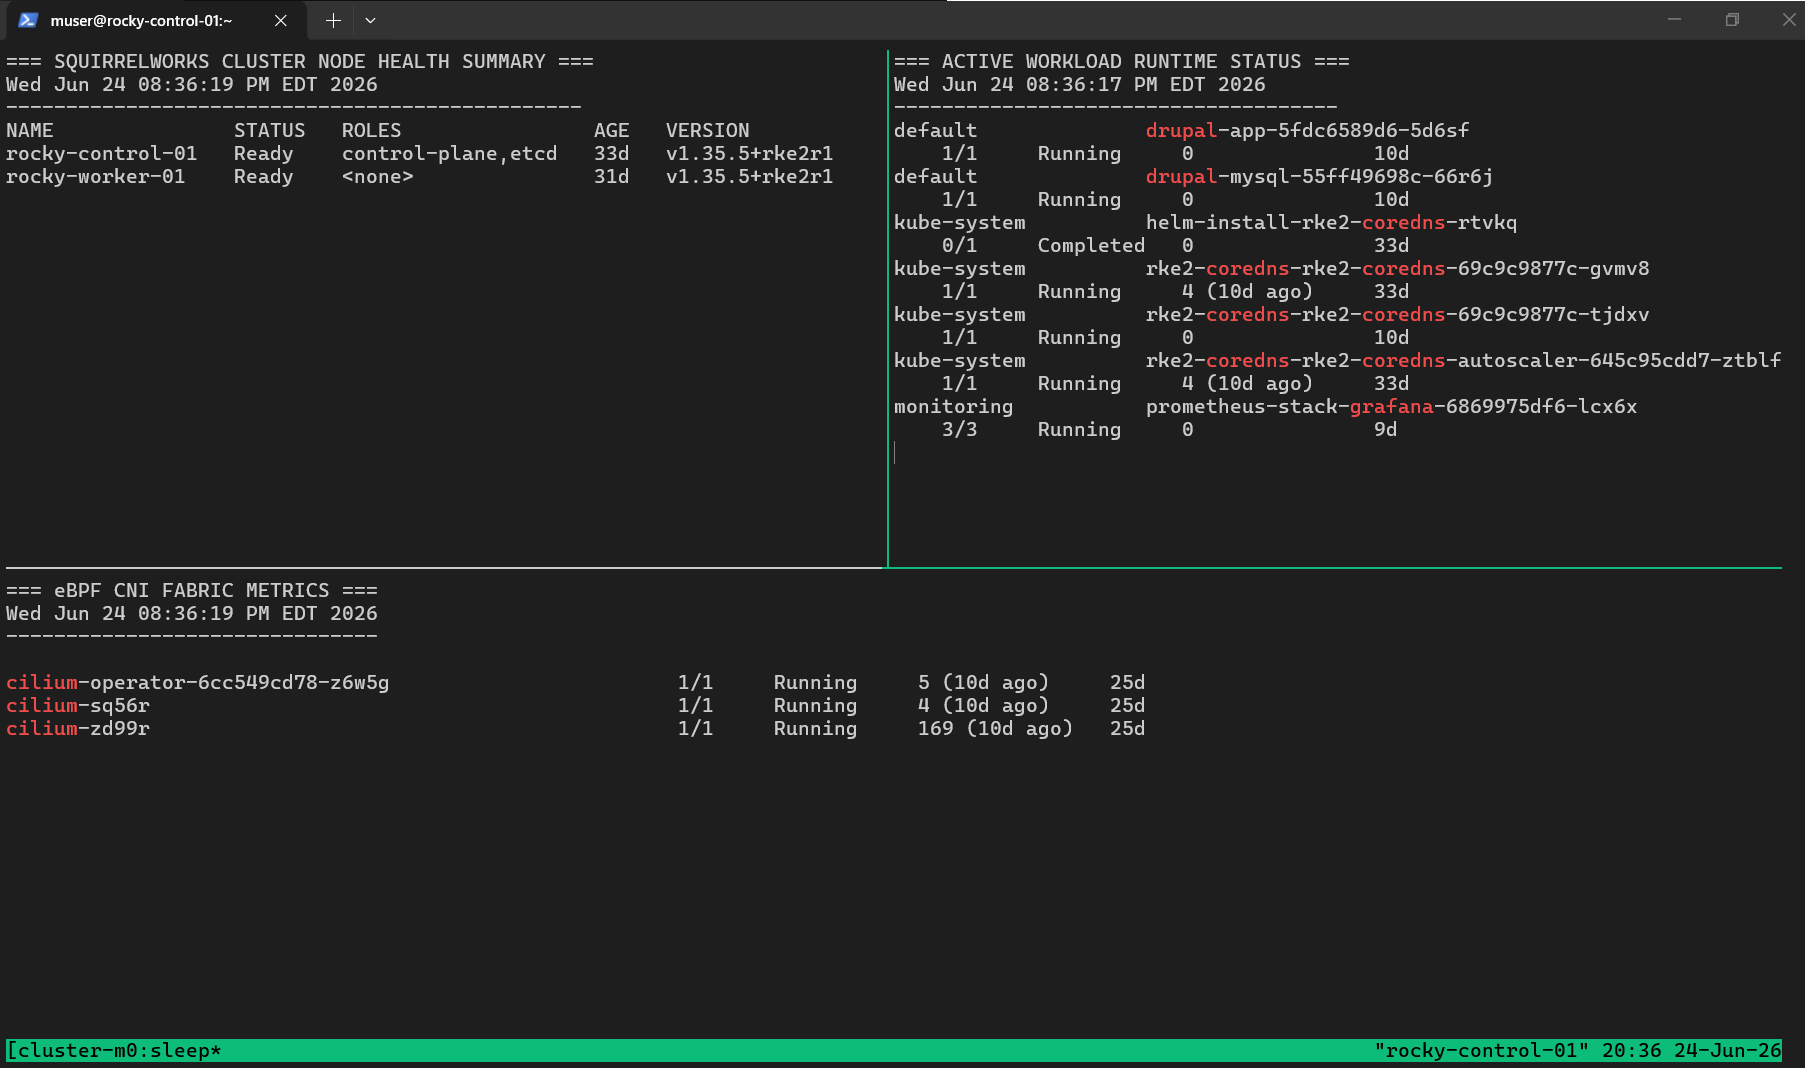
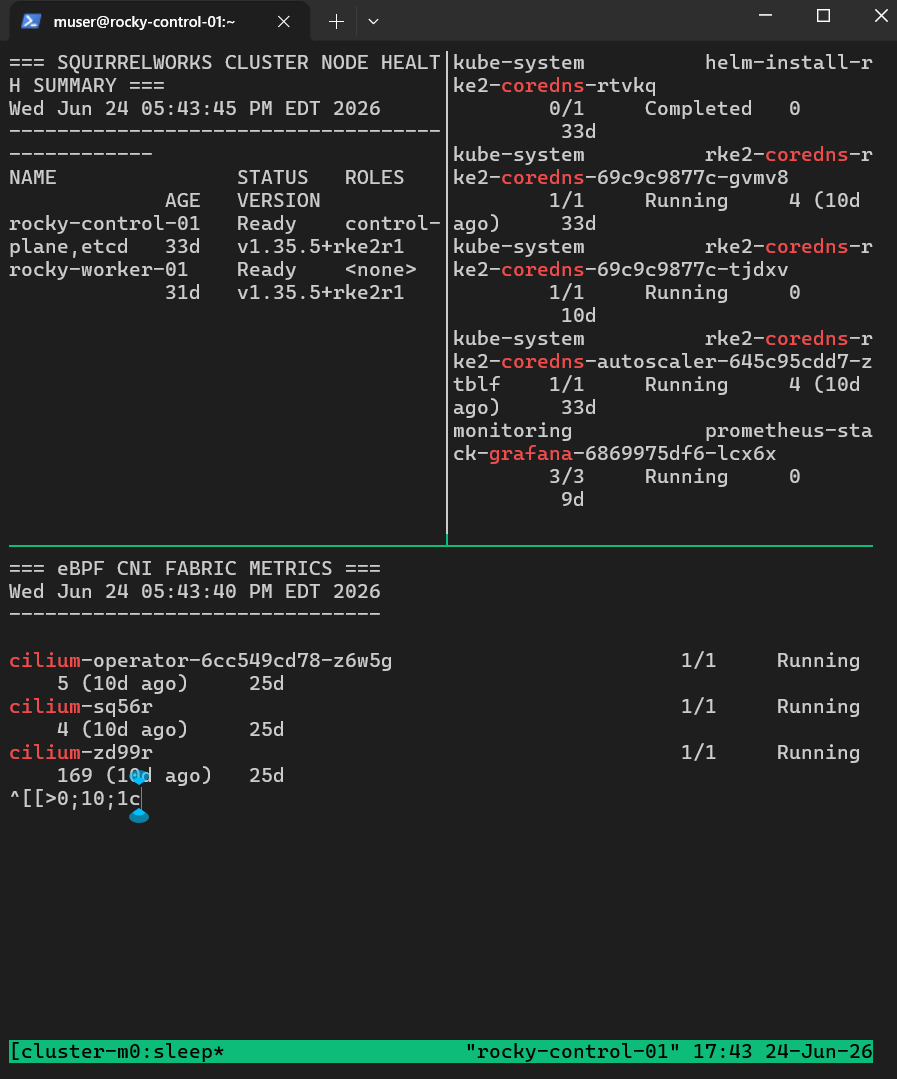
With the layout live and updating, looking at the bright green status engine running along the lower edge reveals the active process tree of the session backplane. Rather than a static footer, this bar operates as a real-time window manager.
The indices inside the bar track exactly what workloads are hitting your shell windows:
sleep because the active window is computing your shell script refresh loops (e.g., ticking down the sleep 5 timer).
Figure: Default TMUX engine truncating the cluster session identification layout string down to 10 characters ([cluster-m]).
By default, TMUX allocates only 10 character spaces on the left side of the telemetry bar, chopping our 15-character cluster-monitor identity string down to a clipped [cluster-m] format.
To expand this without breaking or rebooting running processes, we leverage the interactive runtime command engine. Striking Ctrl + b followed by : drops a live interactive control line along the bottom border. Passing the dynamic configuration override changes the environment immediately:
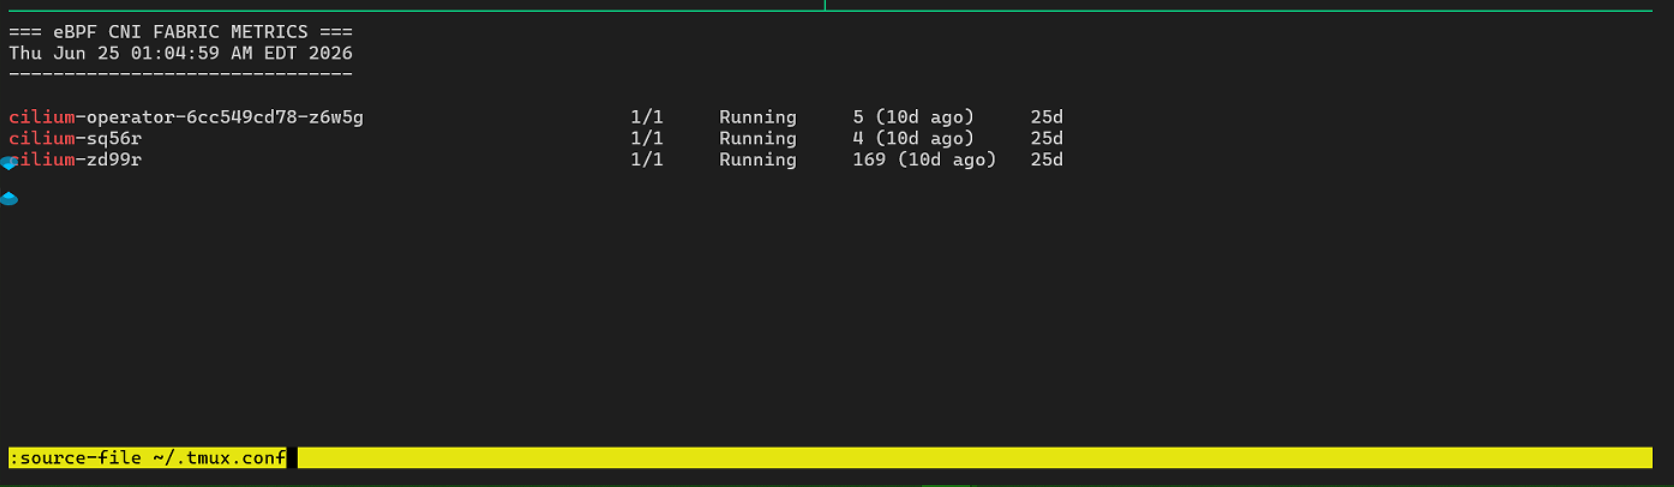
To guarantee that this padded telemetry landscape survives across daemon recycles, host reboots, or new session creations, commit the property rule directly to your local configuration profile:
# Define user runtime configurations (~/.tmux.conf)
set -g status-left-length 20
Once committed, the status bar expands its allocation limits, printing unsegmented runtime states cleanly across the production terminal layer.
 Figure: Completed, un-truncated environment running clean monitoring loops over the multi-node infrastructure space.